OBJECTIVE: To create and illustrate the development of a method to parsimoniously and hierarchically assess upper extremity function in persons after stroke.
DESIGN: Data were analyzed using Rasch analysis.
SETTING: Re-analysis of data from 8 studies involving persons after stroke.
SUBJECTS: Over 4000 patients with stroke who participated in various studies in Montreal and elsewhere in Canada.
METHODS: Data comprised 17 tests or indices of upper extremity function and health-related quality of life, for a total of 99 items related to upper extremity function. Tests and indices included, among others, the Box and Block Test, the Nine-Hole Peg Test and the Stroke Impact Scale. Data were collected at various times post-stroke from 3 days to 1 year.
RESULTS: Once the data fit the model, a bank of items measuring upper extremity function with persons and items organized hierarchically by difficulty and ability in log units was produced.
CONCLUSION: This bank forms the basis for eventual computer adaptive testing. The calibration of the items should be tested further psychometrically, as should the interpretation of the metric arising from using the item calibration to measure the upper extremity of individuals.
Key words: stroke; cerebrovascular accident; Rasch analysis; upper extremity.
J Rehabil Med 2010; 42: 170–178
Correspondence address: Johanne Higgins, Royal Victoria Hospital, 687 Pine Avenue West, Ross Pavilion R4.27, Montreal, Quebec, H3A 1A1 Canada. E-mail: johanne.higgins@mail.mcgill.ca
Submitted April 1, 2009; accepted October 26, 2009
*An abstract from this study was presented at the 2006 ACRM-ASNR Annual Educational Conference, “Translating Research into Practice” in Boston, Massachusetts, USA, on 27 September – 1 October 2006, and was e-published in the journal Arch Phys Med Rehabil 2006; 87: e31.
INTRODUCTION
Choosing appropriate tests and indices to evaluate upper extremity function after stroke is important and serves many purposes, from monitoring change in individuals, to guiding clinical decisions and evaluating rehabilitation programs. The argument for opting for psychometrically sound tests and indices has been made and is now widely accepted (1). Monitoring improvement in upper extremity function can be difficult given the paucity of instruments that accurately reflect function across different stages of recovery. A therapist or a researcher requires a complete range of tests and indices to examine not only the short-term outcomes but also the long-term outcomes (2), and there is no consensus as to which test or index is the best. For example, a compilation of 12 randomized controlled trials evaluating the effect of different treatment strategies for the upper extremity shows that 12 different outcome assessments were used, with little overlap across studies (3). Some authors stipulate that their failure to observe an effect of the treatment may have been due, in part, to the outcome assessment they used. It may not have been targeted to the population under study and it was impossible to detect changes (4). Difficulty in evaluating the upper extremity may be due, in part, to the great variety of tasks and activities it accomplishes. The upper extremity performs an unlimited number of actions that also differ from person to person. Additionally, the activities accomplished by the upper extremity often comprise a high level of motor control and fine dexterity. According to Richards et al. (5), an ideal measure of upper extremity function should contain a wide spectrum of items that span the complete range of item difficulty, from the easiest tasks that can be performed by the most severely affected persons to the most difficult ones that can be accomplished only by those with return to near normal upper extremity function. The tasks included in the measure should require both unilateral and bilateral activities and would take into account the quality of the movements performed. It would also have to be valid and reliable in the specific population targeted by the evaluation. Most of the tests and indices that have been created for measuring upper extremity function have been developed and tested using Classical Test Theory (CTT), where items are scored on an ordinal scale and the total score is the sum obtained on each of the items, all of which have to be administered to obtain a total score. Because the true distances between the items and between the responses options of the items are unknown, the simple summation of scores can lead to wrong conclusions about differences between people as well as about change (6). Over the past few years, Rasch analysis (7) has been increasingly utilized in the field of health outcome measurement to create metrically sound measures. In Rasch analysis, items measuring a similar construct or broad concept are positioned hierarchically along that construct, creating an interval measure, or conceptual ruler, that allows for the measurement of true differences between and within individuals (8). Once the requirements of the Rasch model are met, a standard metric now exists allowing for the measurement of that construct. Items along the continuum represent marks of increasing difficulty in accomplishing tasks.
One very useful application of Rasch analysis is the creation of item banks, which are collections of items calibrated onto the same metric (9). Item banks can lead to adaptive testing, where items from the bank are chosen specifically to target to a particular ability level. When computer-assisted, items are chosen automatically for administration depending on ability and on the response to previous items (10). This yields an accurate estimate of recovery level using the least number of items. The objective of this study was to develop, using Rasch analysis, a method of parsimoniously and hierarchically measuring upper extremity function in persons with stroke by the calibration of a pool of items into an item bank; a step that precedes the development of adaptive testing.
METHODS
Source of items and persons
A secondary analysis of retrospective data from 4058 patients after stroke who participated in studies that included different tests and indices was carried out to create a new bank of items aimed at assessing upper extremity function after stroke. The upper extremity performance tests and indices from which the items were selected had been administered to stroke patients in a wide variety of different settings over the past few years. The 8 studies include longitudinal observational studies as well as randomized controlled trials and data from a Canada-wide survey, the Canadian Stroke Registry (2 cohorts). The tests and indices are presented in Table I.
Items representing the different domains of the International Classification of Functioning, Disability and Health (ICF) were chosen. Tests designed to assess upper extremity function, representing the Body functions and structures domain were included in the pool. In addition, items chosen from indices of Activity and Participation were chosen if upper extremity involvement was deemed to be important for that particular activity. This conservative approach did not delete items that would potentially provide useful information about upper extremity function. All of the research projects had ethical approval and no additional approval was required for secondary analyses of the data.
Personal and health information, as well as clinical features of the stroke, were chosen in order to detect their impact on the way persons performed on the items. These factors were: age, gender, type of stroke, number of co-morbid conditions, side of the hemiplegia, whether the dominant hand was affected, and time of assessment since the stroke. The time of assessment varied across studies, from 10 days to 6 months post-stroke.
Data analysis
One of the requirements for Rasch analysis is unidimensionality (8). As a first step to examine the dimensionality of the items within the upper extremity construct, a series of principal component analyses (PCA) followed by parallel analyses were performed for each data-set separately. Because of the nature of the linking design where there are blocks of missing responses, it was not possible to perform a PCA including all data. Not all items were administered in all studies but there are links between all tests and indices. For example, the Barthel Index and the Stroke Rehabilitation Assessment of Movement (STREAM) were administered in one study and the Barthel Index and the Preference-based Stroke index (PBSI) were administered in another. It was hypothesized that if the Barthel upper extremity items were found to load on the same factor as the STREAM upper extremity items and with the PBSI upper extremity items in their respective studies, then the STREAM upper extremity and the PBSI upper extremity items were also deemed to measure the same construct. First, each data-set was evaluated to determine whether the pre-requisites for conducting PCA were met. Normality was verified (skewness and kurtosis coefficients did not exceed ± 2.0 for the majority of variables) (11). The factorability of the correlation matrix, the absence of multicollinearity, and the presence of outliers was also verified. This analysis served to identify a priori items that may not be measuring upper extremity function. None of the items were removed following this first “triage”.
Some of the indices used for the development of this new bank are not scored on an ordinal scale required for entry into Rasch analysis and had to be transformed. To reduce the potential threat of low precision, the number of categories was kept relatively high, while making sure that the number of persons in each category was sufficient (at least 10) (12).
Rasch analysis was performed to create an item bank from the available pool of items and to further investigate the unidimensionality of the items. (Rasch Unidimensional Measurement Model program (RUMM2020 version)) (13). The sample size required to perform a Rasch analysis yielding stable person and item estimates (± 0.5 logit at the 95% confidence level) and based on an expected standard error level of ± 0.1 is 200 (14, 15).
At this step, the sample was divided into 2 random subsets of persons (samples 1 and 2) and all subsequent steps were performed separately in each sample in order to verify the stability of the item difficulty hierarchy across the 2 subsets once the data fit the model. Because each test or index has a different number of items that are scored on different scales, the Partial Credit Model was chosen (16). Through this procedure, a person’s scores on all items are log-transformed and placed on an interval scale and centered at zero (average item difficulty) (8). Once placed on this linear continuum, items are said to be calibrated if all requirements of the model are met. Rasch analysis was performed on data-sets from all the 8 studies combined. Existing data-sets with overlap between the subsets of data led to a linking procedure where parameters were estimated simultaneously without subsequent re-calibrations (17). For example, the Box and Block Test was used in 3 studies, the Barthel Index in 6 studies and the Medical Outcomes Study 36-Item Short form Questionnaire (SF-36) in 5. Data from the different studies are automatically scaled to the same linear continuum and are directly comparable (17). The linking design of the 8 studies is presented in Table I.
The fit of each item to the model was ascertained through fit statistics that describe the closeness between the observed and predicted scores, standardized residuals, χ2 and F-statistics. Item fit was also assessed graphically using the Item Characteristic Curves (ICCs). In addition, the global item-trait interaction, the sum of the overall χ2 for the items, provided for the whole model fit was used to ascertain compliance to the requirements of the model. Items were considered not to fit if their standardized fit residuals were greater than 2.5 or less than –2.5 and if χ2 and F-statistics were significant. Within each item, participants with less ability should endorse the lower scoring category and people with more ability should endorse a higher scoring category. When the opposite happens, disordered thresholds are observed. Investigation of the utility of the rating scale categories, both statistically and graphically, was undertaken. Some categories were under-used or unused compared with the other categories, and items needed to be re-scored. Once all the items were optimally categorized, misfitting persons and items were removed; remaining items and persons were closely scrutinized for fit to the model.
To assess their fit to the model, participants or persons were divided into 10 groups (class intervals) based on their total item scores. Fit statistics are provided for each person in order to estimate the difference between the Rasch model’s theoretical expectations and the observed person’s performance. When persons did not fit the model, and it was judged appropriate, they were removed from the analysis. Fit was determined by standardized residuals between –2.5 and 2.5. Elimination was done starting with the most misfitting persons based on the mean square residuals. Rasch analysis is an iterative process and the decisions to remove items and persons are made on a combination of statistical and clinical considerations (26).
Items displaying differential item functioning (DIF) change their location on the measurement continuum depending on the characteristics of the group of persons being assessed (6). Once the persons, the items, and their response options were ascertained to fit the model, a DIF analysis was undertaken. For each individual item, scores across each level of influencing factor (also called persons factors) and across different levels of the construct (class intervals), are considered. Each person is identified by a person factor and by a class interval. Standardized residuals for each person attempting each item are analyzed through a standard analysis of variance (ANOVA) (26). DIF was deemed present if analyses of variance were significant (Bonferroni-corrected p-value < 0.0005). Items displaying DIF were either split or removed.
Unidimensionality of the final data bank was ascertained using Smith’s independent t-test approach, where multiple independent t-tests are performed on different subsets of items to determine whether the person’s ability estimates derived from each subset are significantly different (27). Unidimensionality is ascertained if no more than 5% of the t-tests have values outside ± 1.96 (28). Two random subsets of items were created, each containing half of the items (24 and 25 items).
Validity
Construct validity is concerned with the extent to which a test designed to measure a specific theoretical trait or proficiency actually does so. If items representing the different domains of upper extremity function fit the model, evidence of validity is provided. The items should be ordered from easy to difficult and persons should be ordered from least able to most able. The persons’ response patterns were evaluated through their fit statistics.
Relevance, representativeness and item technical quality aspects content validity
The relevance aspect of content validity concerns the degree to which the item bank generally, and the items selected for each individual adaptive test specifically, are representative of the domain of ability. The spread of the items and persons along the measure allows for the confirmation of the representativeness aspect of the items, and the technical quality is addressed by the fit statistics.
Reliability
In the Rasch models, variance of the measurement error is computed from the measurement error that accompanies the patient ability and item difficulty estimates (29, 30). Standard errors indicate the precision of each estimate of item difficulty and person ability (31). It is the “space” within which the true difficulty and true ability should fall. In RUMM, the Person Separation Index (acceptable: 1.5; good: 2.0 and excellent: 3.0) represents the degree to which the relative variation among the persons is not random (26) and the reliability index is interpreted as a Cronbach’s α.
RESULTS
Socio-demographic and stroke characteristics of subjects from the 8 studies as well as those for the final samples are presented in Table II. Subjects were 68 years of age on average (standard deviation (SD) 15 years). The time interval between the stroke and the time of the initial evaluation varied from the different studies from the onset of the stroke to 6 months post-stroke; 37% of the participants had their right side affected and 42% had their dominant upper extremity affected. Approximately 40% of the persons were aged under 69 years, 30% between 70 and 79 years and approximately 30% were aged 80 years and above. Males represented 64% and 62% of the first and second sub-samples respectively. Approximately 50% had more than 3 co-morbid conditions, over 60% had an ischemic stroke, and more than half had their dominant hand affected by the stroke. All of the studies were represented by the final sub-samples. Six percent of persons were drawn from the Walking Competency study, 5% from No Place Like Home, 4% from Bridging the Gap, 4% from Recovery from Stroke, 7% from Brain Capacity, 22% from Quality of Life, 22% from Long Term Outcome of Stroke and 31% from both cohorts of the Canadian Stroke Registry.
Data structure
The initial analysis on the 99 items from all studies revealed that the assumptions underlying this procedure were met. Skewness and kurtosis coefficients did not exceed ± 2.0 for more than 60% of the items; the Kaiser-Meyer-Olkin (KMO) test statistic was greater than 0.50 for each analysis. The PCA followed by parallel analysis (PA) for each individual study revealed the presence of one important factor representing upper extremity function. In each of the individual studies, however, some of the items loaded on a second factor. Some of the items were redundant, with correlations ≥ 0.90. All items were kept to be further scrutinized through Rasch analysis.
The initial fit of the data to the Rasch measurement model produced a significant item-trait interaction for both samples. The data did not fit the model. Misfitting items, misfitting persons or both can be the cause. Several items displaying disordered thresholds were found. The responses for these items were re-coded by collapsing the responses, thus re-ordering the thresholds. After the re-coding of the items, several items still misfit model expectations. Items were removed from the model based on fit residual values above or below 2.5 (range: –10.85–12.40), significant χ2 statistics and F-statistics. Deleted items and the reason for their deletion are presented in Table III. Persons with residuals outside of the recommended range (above 2.5 to 5.09 and from below –2.5 to –11.28) were removed from the analysis, starting with the most misfitting persons. Fit of persons was verified after each item was re-coded or removed. The final person fit residuals ranged from –1.94 to 2.45 for sample 1 and from –1.68 to 2.34 for sample 2.
| Table III. Deleted items and reason for deletion |
| Reason for Deletion | Deleted Items | Description of Items |
| Not loading on upper extremity factor for 1 or more studies and lack of fit to the model | EQ2 EQ3 CNS5 CNS6 HUI24 HUI25 HUI26 HUI27 HUI28 HUI29 HUI30 PBSI4 PBSI5 PBSI6 | Self-care Usual activities Arm Proximal Arm Distal Full use of hands Need help due to hand/fingers Need help for tasks Special equipment Eat, bathe, dress, use toilet Need help eat bathe dress use toilet Special Equipment eat bathe dress use toilet Recreational Activities Work/Activities Driving |
| Lack of fit to the model | NHPT SIS5J SIS7C SIS5D SIS1A SIS1B SIS5C RNL4 RNL6 RI BART2 Frenchay STR10 STR11 STR14 CHE_3 CHE_4 C3_2a b c C3_3a b c C3_5a b C3_6b C3_7b C4_2a b c C4_3a b c C4_4a c C4_6c | Nine-Hole Peg Test Housework (heavy) Open can or jar Cut toe nails Strength arm Strength hand Wash (bath/shower) Self-care needs Recreational Activities Rankin Index Personal Hygiene FRENCHAY Ruler/pencil, grasp cylinder, pick up glass and drink, spring clothes peg, comb hair Oppose thumb to index finger Raise arm overhead Supinate and pronate forearm Not yet stage 2 – arm Not yet stage 2 – hand Resistance to passive shoulder abduction or elbow extension Facilitated elbow extension Facilitated elbow flexion Touch opposite knee Touch chin Shoulder shrugging > ½ range Flexion synergy, then extension synergy Shoulder abduction to 90o with pronation Shoulder flexion to 90o: trace a figure 8 Shoulder flexion to 90o: scissor in front 3X in 5 sec. Positive Hoffman Resistance to passive wrist of finger extension Facilitated finger flexion Wrist extension >1/2 range Finger/wrist flexion >1/2 range Supination, thumb in extension: thumb to index finger Finger extension then flexion Finger flexion with lateral prehension Thumb to finger tips, then reverse 3X in 12 sec |
The presence of DIF was explored for each of the personal factors shown in Table II. Grip strength demonstrated DIF (MS15.57, p = 0.000005) by gender and was split into 2 categories, 1 for women and 1 for men. After the split, grip strength for males still demonstrated both uniform and non-uniform DIF by time from date of stroke for both sub-samples and was removed. One item from the Chedoke-McMaster Stroke Assessment (Shoulder abduction in 90° pronation) demonstrated uniform DIF by number of co-morbid conditions (2.01, p = 0.000006) and was deleted, its deletion improving the overall fit of the model. One item of the SIS (Carrying heavy objects) demonstrated uniform DIF by gender in only one of the samples and was kept in the bank. The fit of the items and persons was verified and deemed to fit the model after these deletions. Forty-nine items remained in the item bank.
Properties of the final banked items
The global fit statistic for samples 1 and 2 (χ2 460; probability 0.25 – χ2 481; probability 0.10, respectively) confirmed that the 49 items in the bank define upper extremity function after stroke. The final 49 items in the bank cover a wide range of difficulty level, from the most difficult located at 5.603 logits, which represent moving 69 blocks or more on the Box and Block Test. The easiest item is a bilateral task of the TEMPA: unlocking and opening a container. The logit associated with being unable to perform this task is located at –8.179 on the upper extremity function continuum. Table IV presents the statistical characteristics of the items in the bank for samples 1 and 2. The unidimensionality of the final item bank was supported by the Smith’s t-tests. Ten out of 803 t-tests (1.2%) and 49 out of 823 (6.0%) t-tests for samples 1 and 2, respectively, showed significant differences in the estimates generated. Even for sample 2, this is considered non-significant, as the 95% confidence intervals (CI) from a binomial distribution include 5% (95% CI 4.4–7.8%).
Targeting
The mean person location value was 1.404, which suggested that the items are not well-targeted to that particular population of patients after stroke. Items are considered “too easy”.
Validity
Evidence for construct validity was demonstrated by unidimensionality and by the reliability of the item hierarchy across persons and by an adequate person reliability index of 0.91 and 0.89 for the 2 random samples, respectively. The basic body functions (Feeding) are easier than more complex activities (Bouncing a ball).
Relevance
Because most of the items in the pool of items originate from standardized measures of upper extremity function whose validity and reliability have already been tested, we can be satisfied that the items chosen will indeed measure upper extremity function and are relevant. Also, 4 items (toileting, eating, washing oneself and dressing), identified as part of a stroke ICF core set, are part of the final item bank measuring upper extremity function after stroke.
Representativeness
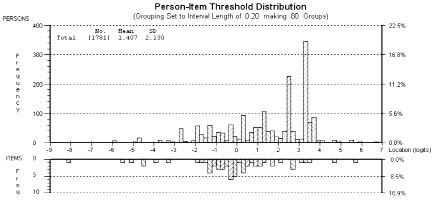
The items in the bank are representative of the ICF domains Body functions and Activity. No items representing Participation were retained. The items cover a broad spectrum of difficulty of the thresholds ranging from –8.18 and –7.98 to 5.60 and 7.59, for the first and second samples, respectively (Fig. 1).
Fig. 1. Upper extremity function items and corresponding subjects’ distribution (top panel). The horizontal axis, in logits, represents the least upper extremity function at the left to the most upper extremity function at the right. The vertical axis represents the proportion of persons or items, and the vertical bars represent the distribution of persons and items at each of the locations.
The fit statistics of the final item bank confirmed the technical quality of the items.
There are 35 items that require observation and rating on the part of a therapist and 14 self-report items pertaining to the level of difficulty or how the person feels they are able to carry out a specific task (the Barthel Index is included in the 14 items, although sometimes it is scored through observation by the therapist). Items representing the ICF domain of Body function cover movements at the shoulder level as well as at the level of the hand. There are unilateral and bilateral tasks. Items representing the Activity domain cover self-care as well as domestic life.
Reliability
The person separation index for the final model was 0.91 and 0.90 for samples 1 and 2, respectively, indicating that the items in the bank have very good person separation reliability.
Stability of the hierarchy
The stability of the hierarchy of the item difficulties was demonstrated across the 2 random samples. The distributions of the locations of the items in the 2 samples did not differ (Friedman’s p = 0.1161). This confirms the internal consistency of the person ability location.
DISCUSSION
A unique bank that incorporates 49 items testing both capacity and performance related to upper extremity function post-stroke was created. Despite the need to eliminate persons from the analyses, the final study sample (random samples 1 and 2) showed characteristic in terms of age, proportion of males and with ischemic strokes similar to stroke populations described previously in the literature (32). One of the reasons there were so many persons who did not contribute data to the item calibrations is that, in some of the studies, only a few items were administered and in the item reduction process some records became invalid because persons were only administered items that were deleted or persons became “extreme” if they had a perfect score on the few items that were retained. This caused a reduction in the sample size used for the estimation process, as these invalid records and extreme scores are not used in the estimation of item and person parameters. Starting with the 99 items and 4058 individuals, the iterative process resulted in 49 items and 1636 individuals. Because of the large sample size available to this study, this reduction does not affect estimation accuracy.
The items contained in the bank span a wide range of upper extremity ability and are representative of the domains of the ICF Body Structures and Function and Activities. Included in the bank were both unilateral and bilateral tasks. A group of researchers gathered evidence from the literature in order to identify the most common problems among patients after stroke using the ICF checklist and formed a “core set” of items for stroke (33). Under the Activities and Participation component, 4 items (toileting, eating, washing oneself and dressing) requiring the use of the upper extremity were included in the preliminary core set. These 4 items are part of the final item bank measuring upper extremity function after stroke. The inclusion of bilateral tasks is important, as they indicate the degree to which the affected limb contributes to the task. Some of the items evaluate the degree of recovery of movement at specific joints, others assess manipulation, reaching and grasping, while others assess activities such as bathing, dressing, doing housework and carrying bags, a good indication of content validity. Rasch analysis also contributed to the confirmation of the latent construct of upper extremity function. By fitting items from the 2 main domains of the ICF, both capacity and performance items as well as uni- and bi-lateral tasks contributed to the evidence that all these are important to capture when measuring upper extremity function and are really part of that construct. This is in agreement with the definition developed by Barreca et al. (34): “The main purpose of the arm and hand is to move as an integrated unit in various directions so as to stabilize, reach, grasp, and manipulate objects of various sizes and weights repeatedly in order to perform basic life skills such as feeding, dressing personal care, domestic chores, mobility, and communication. Functional use of both arms allows the client optimal completion of various activities of living, work, and leisure”.
While some items may seem redundant, such as the Barthel 4 – Dressing and Undressing, and the SIS5B – In the past 2 weeks, how difficult was it to dress the top part of your body?, these 2 items cover different concepts, the Barthel 4 evaluates ability and the SIS item covers the level of difficulty in accomplishing the task. Both items were felt to be different enough to keep. Patient-reported outcomes, such as the SIS item mentioned above, are becoming increasingly important, as their value has been recognized in the measurement of health outcomes. While the information on how a person feels they can function comes directly from the clients, the amount of difficulty in performing tasks is of utmost importance when deciding rehabilitation goals with the patient. Additionally, performance items are important for clinicians as they should observe firsthand what clients are able to perform. All items, self-report and performance, fit the Rasch measurement model and could be used as part of an adaptive measure as long as they are used in the same way they were developed. To include both these types of items could also serve a very important purpose. Most of the activities items are self-report, and this could provide important information, while shortening considerably the evaluation time, as there is no absolute need to have the persons perform the activity.
Initial psychometric evaluation of this bank indicates that construct validity was achieved through fit of the items and persons to the model as well as by an excellent person reliability index. The SF-36 and the SIS have been re-scored by other researchers in the same manner as here, by collapsing the middle categories (35, 36). Interestingly, most of the test and indices were re-scored by collapsing the easiest categories. This illustrates how inadequate the simple summation of scores in CTT is, as the distances between each of the categories are unknown. Without testing the distance between response categories, the assumption of equal distance as is used can lead to misinterpretation of scores. The DIF seen in grip strength makes clinical sense, as women have less upper body strength and should not be placed at the same level as men on an ability scale. However, grip strength for males was discarded due to important misfit to the model. Also, no participation items are included in the final bank of items. Very few participation items were included initially in the pool of items (RNL4 and 6), and these items simply did not fit with the rest. This may have been because, when participants are asked about their limitations in work and activities, they may be considering not only their upper extremity but also their ability to walk and get around or any other factor that may affect their ability to participate in life roles. Because there were so few participation items, it was not possible to determine whether they formed a factor of their own and should therefore produce a valid separate scale. Adding participation items would greatly enhance the comprehensiveness and usefulness of this bank and fill the gaps at the higher end of the continuum. This would improve the targeting, which does not match the stroke population in this study. The items were too easy for this particular group. Because very few participation items are specific to the use of the upper extremity, it might prove necessary to create entirely new items. Items that include “upper extremity” in the statement for example: Does your affected upper extremity limit you in your participation in your work or activities? These items would have to be co-calibrated within the existing bank and meet all the requirements for unidimensionality.
This bank forms a basis for, and opens the way for the future of measurement of upper extremity function in clinical settings and research. By a process of equating and anchoring, new items can be added and calibrated to expand the bank and improve the psychometric properties of the items and the bank. As the items will be presented to participants, they can be re-calibrated, their properties can be further examined (e.g. the presence of DIF), increasing their stability.
The items contained in this bank are calibrated on a single scale and thus different subsets of items can now be used to create shorter instruments tailored to a particular status, time or setting. Each client is administered a “test” custom-tailored to their level of ability. Thus, clients are not burdened by answering questions or performing tasks that do not apply to them. Furthermore, the evaluation process is much shorter and does not affect the level of accuracy of the measure. Also, direct comparisons within and between clients are possible due to the “mapping” of every item onto a common scale.
The rapid emergence of new computer technologies will make the collection of data in electronic format increasingly feasible and cost-effective. Future work will lead to the creation of adaptive testing in paper or computer format using this unique bank.
Limitations
The number of tests/indices of upper extremity function included in the bank is limited to those used in the studies. Despite the fact that the items capture a wide range of difficulty, gaps appear in some locations, making the estimation of the ability of persons located near or within those gaps less precise. Because of the nature of the linking design where there are blocks of missing data, PCA of the residuals was impossible to calculate directly by the software. This also prevented the selection of subsets of item combinations from the person residual grid and estimation of specific sets of correlations due to small samples sizes that could be retrieved from the matrices and a stable factor analyses cannot be performed on such small sample sizes. In addition, some of the items were administered only as part of a single study, and this may have rendered their estimates unstable and may have contributed to their deletion from the model.
In conclusion, using this unique bank of 49 upper extremity function items, it is now possible to assess upper extremity function post-stroke. This opens the way to adaptive testing, in which items are administered based upon previous responses. Instead of being presented with all the items in a single test, patients, need respond only to those items that are the most informative. This will considerably shorten the evaluation time required to determine the patient’s level of ability in upper extremity function and decrease the level of stress and fatigue for participants and therapists alike.
ACKNOWLEDGEMENTS
The following funding agencies are acknowledged for their support: Fonds de recherche en santé du Québec, the Canadian Stroke Network, and the McGill University Health Centre Research Institute.
REFERENCES