OBJECTIVE: To identify changes in impairments associated with functional and pain outcome in patients with patellofemoral pain syndrome following a standardized physiotherapy treatment.
DESIGN: One group pre-post design.
SUBJECTS: Seventy-four patients (median age 27 years, 52% female) diagnosed with patellofemoral pain syndrome and referred to physiotherapy treatment.
METHODS: Baseline measures included self-reported function and pain, which were the dependent variables, and measures of independent variables: strength of quadriceps, hip abduction and hip external rotation; length of hamstrings, quadriceps, plantar flexors, iliotibial band/tensor fascia lata complex, and lateral retinaculum; quality of movement, and fear-avoidance beliefs. Following the baseline measurements, subjects participated in a standardized physiotherapy program. Measurements were repeated at 2-month follow-up. Data were analyzed using 2 forward regression models, the first using function outcome, and the second using pain outcome as the criterion. Age, gender, height and weight were controlled in the regression models.
RESULTS: Change in fear-avoidance beliefs about physical activity and change in gastrocnemius length predicted function outcome. Change in fear-avoidance beliefs about physical activity and about work predicted outcome of pain.
CONCLUSION: Change in fear-avoidance beliefs about physical activity was the strongest predictor of function and pain outcome. The fact that patients who decreased their fear-avoidance beliefs improved function and decreased pain indicates that perhaps fear-avoidance beliefs should be targeted during the treatment of patients with patellofemoral pain syndrome.
Key words: patella, knee, fear-avoidance beliefs, psychological factors, physical therapy, physical impairments.
J Rehabil Med 2009; 41: 604–612
Correspondence address: Sara R. Piva, 6035 Forbes Tower, Department of Physical Therapy, University of Pittsburgh, Pittsburgh, PA 15260, USA. E-mail: spiva@pitt.edu
Submitted March 18, 2008; accepted February 20, 2009
INTRODUCTION
Patients with patellofemoral pain syndrome (PFPS) account for 10–25% of all physiotherapy (PT) visits (1). Despite the fact that PT is the most frequently used conservative treatment for PFPS, studies report that approximately 25% of patients continue to have pain and dysfunction for more than one year after PT has been completed (2). A systematic review on treatment of PFPS suggested that improvements in pain and function due to PT are consistent only in the short-term and there is inconclusive evidence to support the superiority of a particular intervention compared with another (3). In view of this, it seems essential that the effectiveness of PT for patients with PFPS be enhanced.
PT treatment is often based on improving impairments related to PFPS. However, little evidence is available on whether changes in impairments targeted during the PT treatment are in fact responsible for the improvements in pain and function experienced by these patients. Identification of the key impairments that, when changed, affect subject’s pain and function may help to delineate more effective PT interventions for this population. Impairments commonly targeted during PT treatment are muscle weakness, muscle and soft tissue tightness, and poor quality of movement.
Weakness of the quadriceps muscles is frequently addressed during PT treatment because studies have demonstrated a small decrease in pain and increase in function in patients who received a regimen of quadriceps muscle strengthening (3–5). Weakness of the hip abductors and external rotators muscles have been addressed in PT because individuals with PFPS are weaker than controls in these muscles and strengthening of the hip muscles may be helpful to decrease pain in this population (6–8).
Muscle and soft tissue tightness is also targeted during PT treatment. Use of techniques to stretch the quadriceps is based on the evidence that individuals with PFPS have shorter quadriceps muscles than subjects without PFPS (9, 10). Regardless of the conflicting evidence that hamstring tightness contributes to PFPS, hamstrings stretching is commonly used in an attempt to decrease the passive resistance offered by these muscles. Increased hamstring’s passive resistance could demand higher quadriceps force or cause a slight flexed knee and increase patellofemoral joint reaction forces. Stretch of the plantar flexors is based on the theory that limited ankle dorsiflexion can cause either excessive subtalar pronation or external rotation of the foot to allow the lower leg to move forwards during the terminal stance phase of gait, both of which may result in excessive rotation of the lower extremity and increase patellofemoral contact pressures. However, study results conflict regarding the association between plantar flexors tightness and the presence of PFPS (11, 12). Although there is no evidence that tightness of the iliotibial band/tensor fascia lata (ITB/TFL) or the lateral retinacular structures contribute to PFPS, clinicians seem to believe that stretching these structures is beneficial in reducing pain in these patients.
Another impairment theoretically related to PFPS is poor quality of movement. It was suggested that the altered movement patterns seen in patients with PFPS may result in abnormal load distribution across the patellofemoral joint and contribute to PFPS (1, 13). Poor movement control is sometimes targeted by PT through the use of movement control exercises. And lastly, although not commonly incorporated in the treatment of patients with PFPS, authors have suggested that psychological factors seem to be overlooked in these patients, and perhaps psychological treatment should be considered in these patients (10, 12, 14). One such factor may be fear-avoidance beliefs. Avoidance behaviors have been associated with disability in cross-sectional studies performed in patients with a variety of musculoskeletal pain conditions (5, 15). Furthermore, in patients with low back pain, changes in fear-avoidance beliefs predicted changes in self-reported disability (16, 17).
We believe that if changes in some of the above-mentioned impairments following PT treatment predict outcome of pain, targeting such impairments may improve the effectiveness of PT for patients with PFPS. The aims of this study were: (i) to identify changes in impairments associated with functional outcome; and (ii) to identify changes in impairments associated with pain outcome in patients with PFPS following a standardized PT treatment.
METHODS
Subjects
Individuals were eligible to participate in this study if they were referred to PT with a primary diagnosis of PFPS, were between 12 and 50 years of age, had pain in one or both knees, had duration of signs and symptoms greater than 4 weeks, had history of insidious onset not related to trauma, and had pain in the patellar region with at least 3 of the following: manual compression of the patella against the femur at rest or during an isometric knee extensor contraction; palpation of the postero-medial and postero-lateral borders of the patella; resisted isometric quadriceps femoris muscle contraction; or during activities such as squatting, stair climbing, kneeling, or prolonged sitting.
Exclusion criteria included previous patellar dislocation, knee surgery over the past 2 years, concomitant diagnosis of peripatellar bursitis or tendonitis, internal knee derangement, systemic arthritis, ligamentous knee injury or laxity, plica syndrome, Sinding-Larsen’s disease, Osgood-Schlatter’s disease, infection, malignancy, musculoskeletal or neurological lower extremity involvement that interferes with physical activity, and pregnancy.
Measures
After signing a consent form, subjects participated in a baseline session in which they completed a demographic and history questionnaire, rated their activity level using the rating developed by the International Knee Documentation Committee (18), and completed self-report questionnaires and a physical examination to measure physical impairments. The physical examination was performed by a licensed PT. Subjects had only one lower extremity tested. If subjects had bilateral knee pain, the most painful lower extremity was selected for testing. Following the baseline testing session, subjects participated in a standardized 8-week PT program. Measurements were repeated after the completion of the PT program. Change scores (follow-up score minus baseline score) were calculated for each of the outcome measures listed below.
Criterion variables.
Physical function was measured at baseline and follow-up by the Activity of Daily Living Scale of the Knee Outcome Survey (ADLS) (19). The ADLS is a knee-specific measure of physical function that assesses the effects of knee impairment on activities of daily living. Each item is scored on 6-point Likert scale (0–5 points). The ADLS score is transformed to a 0–100-point scale with 100 indicating the absence of symptoms and functional limitations. The ADLS has shown to be reliable, valid and responsive in subjects with patellofemoral pain (19, 20).
Pain intensity was measured at baseline and follow-up using an 11-point numeric pain rating scale (NPRS) anchored on the left with the phrase “No pain” and on the right with the phrase “Worst imaginable pain”. NPRS were shown to be reliable and valid (21). Subjects rated their current pain, the worst pain, and the least amount of pain in the last 24 h, and the ratings were averaged.
Predictor variables. These were measured at baseline and follow-up and included physical impairments and fear-avoidance beliefs. Physical impairments measured included muscle strength (quadriceps femoris, hip abduction, hip external rotation), soft tissue length (hamstrings, quadriceps, gastrocnemius, soleus, ITB/TFL complex, lateral retinacular structures), and quality of movement. The inter-tester reliability of measures of physical impairments was determined during this study and has been reported elsewhere (22). Table I provides a description of physical impairments measures and their psychometrics.
| Table I. Techniques used to perform impairment measures |
| Measure | Technique |
| Quadriceps strength | Measured using an isokinetic dynamometer (Biodex System 3 Pro, Shirley, NY, USA). The subject was seated with the tested knee flexed to 75°. The subject was instructed to exert as much force as possible using an isometric contraction while extending the knee against the force-sensing arm of the dynamometer. The contraction was repeated for 4 trials and the trial with the maximum torque was recorded. ICC reported was above 0.80 (40). SEM in our lab 8.7 Nm. |
| Hip abduction strength | Measured with a hand-held dynamometer (Lafayette Manual Muscle Tester System, Lafayette Instrument, Lafayette, IN, USA) with the subject side-lying with the tested hip positioned superior in relationship to the non-tested hip. The subject exerted an isometric contraction of the hip abductors against the resistance of the dynamometer positioned proximal to the lateral malleolus. The average force of 2 trials with 1 min of rest between trials was recorded. ICC 0.85, SEM 1.8 kg (22). |
| Hip external rotation strength | Measured with the hand-held dynamometer. Subject was lying prone with the tested knee flexed to 90° and the hip in neutral rotation. Subject exerts an isometric contraction of the hip external rotators against the resistance of the dynamometer positioned just proximal to the medial malleolus. The average force of 2 trials with 1 min of rest between trials was recorded. ICC 0.79, SEM 2.4 kg (22). |
| Hamstrings length | Determined using the straight leg raise test with the subject lying supine. The lower extremity was passively lifted to the firm end feel. Angle of the straight leg raise test was measured with a gravity goniometer (MIE Medical Research Ltd., Leeks, UK) placed over the distal tibia. The average of 2 trials with 5-sec pause between trials was recorded. ICC 0.92, SEM 4.3° (22). |
| Quadriceps length | Determined by measuring passive knee flexion using the gravity goniometer placed over the distal tibia with the subject in the prone position. The average measurement of 2 trials with 5-sec pause between trials was recorded. ICC 0.91, SEM 3.8° (22). |
| Plantar flexors length | Measured with a standard goniometer with the subject in prone. We measured the amount of ankle joint dorsiflexion with the knee extended and again with the knee flexed at 90°. Ankle dorsiflexion measured with the knee extended was used to account for the influence of gastrocnemius tightness. Measurement of ankle dorsiflexion with the knee bent was used to detect tightness of joint capsule or soleus muscle. The average measurement of 2 trials with 5-sec pause between trials was recorded. Knee extended ICC 0.92, SEM 1.6°. Knee bent ICC 0.86, SEM 2.2° (22). |
| ITB/TFL complex length | Determined by using the Ober’s test. A gravity goniometer was placed over the distal portion of the ITB/TFL complex to record the result of the test as a continuous variable. The gravity goniometer was zeroed on a horizontal surface prior to the measurement. Negative values represented more tightness whereas positive values (below horizontal) represented less tightness. The average of 2 trials with 5-sec pause between trials was recorded. ICC 0.97, SEM 2.1° (22). |
| Lateral retinaculum length | Assessed with the patellar tilt test. The examiner attempted to lift the lateral edge of the patella from the lateral femoral condyle with the subject in supine and the knee in full extension. The inability to lift the lateral boarder of the patella above the horizontal plane indicates a positive test for tightness. Lateral retinacular length was recorded as tight or normal. Kappa 0.71 (22). |
| Quality of movement | Measured during the lateral step-down test. The subject stands on a 20 cm high step and bent the tested knee until the contralateral leg gently contacted the floor and then re-extended the knee to the start position for 5 repetitions. The movement was scored according to the use of arm strategy, trunk movement, plane of pelvis, medial deviation of the knee, and steadiness of unilateral stance (29). Total score of 0 or 1 was classified as good quality of movement, score of 2 or 3 as medium quality, and score of 4 or above was classified as poor quality of movement. Kappa 0.67 (22). |
| ICC: intra class correlation; SEM: standard error of mean; ITB/TFL: iliotibial band/tensor fascia lata. |
Fear-avoidance beliefs. These were measured using the Fear-Avoidance Beliefs Questionnaire (FABQ). The FABQ quantifies the level of fear about work and physical activity and has primarily been studied in patients with low back pain (23). The instrument consists of 16 items subdivided into 2 subscales, one that measures fear-avoidance beliefs about physical activity (FABs-PA) and the other that measures fear-avoidance beliefs about work (FABs-W). Each item is scored from 0 to 6. Possible scores range from 0 to 42 and from 0 to 24 for the FABs-W and FABs-PA subscales, respectively. Higher scores represent increased FABs. Previous studies reported good reliability of the FABQ (24). To apply the FABQ in patients with PFS, we adapted the original FABQ form. We changed the descriptors of physical activities from “physical activities such as bending, lifting, walking or driving” to “physical activities such as walking, running, kneeling or driving”, and we also changed the word “back” with “knee” throughout the form. The FABQ has been used previously in patients with knee osteoarthritis (25).
Physical therapy program
All subjects received the same standardized treatment program consisted of 8 treatment sessions administered during 8 weeks. Participant sites were trained in the exercise program, taping procedures, and were provided with a detailed “Manual of Standard Operating Procedures” that outlined the procedures to be used in this study. As previous studies have shown that exercise improves function and decreases pain in this patient group without showing that particular exercise programs are better than others, the treatment program incorporated a combination of several approaches shown to improve pain and function in patients with PFPS, including strengthening, stretching, and patellar taping (4, 5, 26).
Patellar taping was applied to all patients at the beginning of each treatment session using the taping technique proposed by McConnell (27). Patellar taping was left on the knee for the whole exercise session. Next, a warm-up took place by having the patient ride a stationary bicycle for 5 min. Initially, the bicycle had no resistance, and the resistance progressed as tolerated by the patient. Following the warm-up, the stretching exercises included quadriceps, hamstrings, and plantar flexors stretching, as follows:
• Hamstring stretches were performed in a sitting position with the knees straight. Subjects reached forward attempting to touch the toes without rounding the back.
• Quadriceps stretch was performed in a standing position with the pelvis posteriorly rotated. Subjects tried to bring the heel of the side being stretched as close to the buttocks as possible, while keeping the hip in neutral flexion/extension.
• Plantar flexors were stretched in a standing position with both hands against a wall and with one foot in front of the other such that the leg being stretched was at the back. The subject bent the forward knee while pushing the heel of the leg in the back towards the floor keeping that knee straight. Stretching exercises were held for 20 sec and repeated 5 times.
Strengthening exercises included quadriceps strengthening in weightbearing and non-weight-bearing conditions:
• Quadriceps setting was performed in a supine position; subjects contracted their quadriceps as strong as they possible could for 5 sec.
• Straight leg raises were performed in supine; subjects raised their lower extremity by bending the hip to a position where it was around 45°. Resistance to this exercise was added with cuff weights.
• Double leg squats from 0–50° of knee flexion were performed in 2 conditions: standing against the wall with the feet approximately 10 cm apart, and standing away from the wall with the feet approximately 30 cm apart; subjects squatted down by bending at the hips, knees, and ankles, being careful to keep the knees aligned with the ankles. Resistance to this exercise was added by holding dumbbells.
• Unilateral step-down and step-up exercise was performed with the subjects standing with the affected leg on a step 22 cm high; subjects bent the affected knee to slightly touch the foot of the non-affected side to the floor while keeping hips, knee, and foot in proper alignment. Subjects performed 3 sets of 10 repetitions each. For the first set, subjects stepped down forward, for the second set stepped sideways, and for the third set stepped backwards on the step. Resistance to this exercise was added by holding dumbbells.
• Short arc leg extension seated on a leg extension machine with the knee flexed from 90° to 50°. The exercises were progressed from 10 repetitions to 3 sets of 10 repetitions. Once the subject could complete 3 sets of 10 repetitions with good form, resistance was added/increased in 2 lb (0.9 kg) increments.
Subjects were asked to perform a home exercise program 2 times a week during the treatment period. The home exercise program consisted of the same exercises performed in the clinic as well as patellar taping. Compliance with home exercises was self-reported in an exercise log.
Data analysis
To detect recording and formatting errors we listed the 5 largest and smallest values for every variable. To test for normality of distributions we performed Shapiro-Wilk tests. Then, we calculated descriptive statistics for all variables (frequency tables for nominal or ordinal variables with few distinct values, medians and quartiles for ordinal variables with large number of distinct values or continuous variables non-normally distributed, and means and standard deviation for continuous variables with normal distribution).
Because it was not possible to obtain complete follow-up data on all initially recruited patients, we had to determine if the sample of subjects with complete data were representative of the initially recruited sample. We determined whether baseline characteristics of patients with complete and incomplete data differ by using Pearson χ2 for nominal variables, whereas, depending on the data distribution, Mann-Whitney U-test or independent t-tests were used for continuous variables. After this, we eliminated subjects with incomplete data and ran the following analyses only with subjects for whom the data were complete.
To determine whether the criterion and predictor variables changed over time, Wilcoxon signed ranks, McNemar, or Marginal Homogeneity Tests were used depending on data distribution. We then created change scores for all variables (2-month minus baseline score for each individual). Frequency histograms, normality tests (Shapiro-Wilk), and descriptive statistics were calculated for the change variables. To check for possible non-linear relationships or uneven distribution of the data we plotted each criterion variable (change in function and change in pain) as a function of each predictor. After that, we ran binary correlations between predictors and change in function and change in pain. Pearson’s or Spearman’s rho coefficients were used depending on data distribution. To account for the effect of body size on changes in muscle strength and length, height and weight were partialed out during the bivariate correlations. Predictors significantly correlated with the criterion variables (α ≤ 0.10) were included in the regression analysis. Two separate forward regression models were created to predict changes in function (ADLS) and changes in pain (NPRS). Age and sex were controlled in the regression models. Statistical significance was determined using an alpha level of 0.05. Regression coefficients and standardized beta coefficients for each variable in the final model were calculated and the significance of each was tested under the null hypothesis that the coefficient was not different from zero. Lastly, we observed the distribution of the jackknife and standardized residuals and monitored the random distribution of residuals, comparison of distribution between plots, and number of residuals exceeding 1.96 in absolute value. We also calculated the variance inflation factors of each regression model.
RESULTS
A total of 74 patients were recruited from 4 clinical sites (Minot Air Force Base in Minot, ND, Lackland Air Force Base in San Antonio, TX, Travis Air Force Base in Fairfield, CA, and University of Pittsburgh’s Centers for Rehab Services in Pittsburgh, PA, USA). The population was comprised of civilians and military personnel.
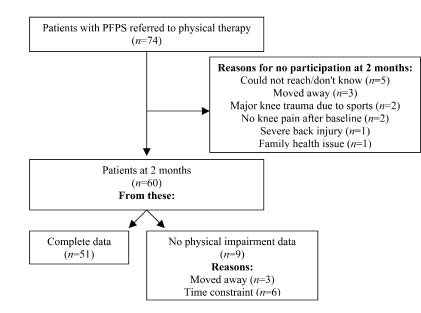
Fifty-one subjects completed all the testing procedures and 9 subjects agreed to mail back the self-reports but could not come to the clinics to perform the physical examination. Therefore, data on self-reports are available for 60 subjects, whereas complete data for analysis is available for 51 subjects. Fig. 1 shows the participants flow during the study. From the 51 patients with complete data, 46 (90%) completed the PT program, and 47 (91%) returned the home exercise log. The mean number of exercises completed at home by these patients during the 8 weeks of the PT program was 14 ± 6.5 sessions.
Fig. 1. Patient course during the study. PFPS: patellofemoral pain syndrome.
Baseline demographic and biomedical characteristics, and function and pain scores are reported in Table II. There were no significant differences between patients with complete (n = 51) and incomplete data (n = 23) in the variables age, gender, height, weight, race, activity at work, use of pain medication, chronicity of pain, activity level, ADLS score, and NPRS score. It appeared that those included in the analysis were representative of the entire sample of people with PFPS. In our sample only 3 patients were younger than 18 years and these patients did not differ from the older patients with regards to function and pain measures (data not shown).
| Table II. Baseline descriptive statistics of demographics, biomedical information, function and pain scores of the sample of subjects with patellofemoral pain syndrome (PFPS) |
| Baseline characteristics | Complete data (used in analysis) n = 51 | Incomplete data n = 23 | p-value |
| Age, median (25th–75th quartile) | 26 (22–38) | 28 (24–38) | 0.323* |
| Female, n (%) | 27 (53) | 12 (52) | 0.573† |
| Height, cm, mean (SD) | 169 (10) | 170 (15) | 0.981‡ |
| Weight, kg, mean (SD) | 74 (15) | 81 (16) | 0.104‡ |
| Race, n (%) Caucasian African-American Hispanic Asian Native-American Other | 37 (72) 4 (8) 5 (10) 2 (4) 0 3 (6) | 13 (57) 4 (17) 3 (13) 1 (4) 1 (4) 1 (4) | 0.570† |
| Work, n (%) Mostly sedentary Sedentary, walking Moderately active Demanding | 11 (22) 9 (17) 25 (49) 6 (12) | 7 (30) 4 (17) 9 (39) 3 (13) | 0.832† |
| Medication for pain, n (%) | 30 (59) | 13 (57) | 0.853† |
| Chronicity of pain, n (%) 1–3 months 4–6 months 7–12 months 13–24 months > 25 months | 21 (41) 12 (24) 5 (10) 9 (17) 4 (8) | 6 (26) 5 (22) 2 (9) 4 (17) 6 (26) | 0.446† |
| Activity level, n (%) Jumping, pivoting, cutting Heavy manual work Light manual work Activities of daily living | 8 (16) 4 (8) 14 (27) 25 (49) | 1 (4) 2 (9) 8 (35) 12 (52) | 0.571† |
| Activity of Daily Living Scale, median (25th–75th quartile) | 71.4 (55.7–78.6) | 65.7 (45.7–80.0) | 0.426* |
| Numeric Pain Rating Scale, median (25th–75th quartile) | 3.7 (2.3–5.0) | 1.3 (2.7–6.3) | 0.347* |
| *Tested with Mann-Whitney U-test. †Tested with χ2. ‡Tested with independent t-test. SD: standard deviation. |
Table III depicts the descriptive statistics of baseline, 2-month, and change scores of the criterion and predictor variables. Non-parametric tests for related samples demonstrated that improvements in both criterion variables (function and pain) were statistically significant. Significant improvements were also observed in the predictors quadriceps femoris strength, quadriceps, hamstrings and soleus length, quality of movement, and FABs-PA.
| Table III. Descriptive statistics of the criterion and predictor variables for baseline, 2-month, and change scores. Categorical data are presented as frequencies (%), data from continuous or ordinal variables are reported as medians and quartiles |
| | Baseline Median (25th–75th quartile) | 2-month Median (25th–75th quartile) | p-value | Change 2-month minus baseline Median (25th–75th quartile) |
| Activity of daily living scale | 71.4 (55.7–78.6) | 82.9 (67.1–91.4) | < 0.001* | 10.0 (–2.87–22.86) |
| Numeric pain rating scale | 3.7 (2.3–5.0) | 2.0 (1.0–4.3) | < 0.001* | –1.67 (–2.67– –0.33) |
| Quadriceps strength, Nm | 175 (126–245) | 175 (144–269) | < 0.001* | 8.0 (–5.2–33.5) |
| Hip abductors strength, kg | 12.2 (8.1–15.9) | 12.0 (9.4–14.8) | 0.685* | 0.15 (–1.0–1.85) |
| Hip external rotators strength, kg | 13.9 (11.1–19.7) | 14.8 (11.8–19.5) | 0.214* | 0.55 (–0.95–1.8) |
| Hamstrings length, º | 75 (70–87) | 81 (76–88) | 0.008* | 4.0 (–1.5–7.5) |
| Quadriceps length, º | 132 (126–140) | 135 (126–144) | 0.005* | 3.5 (–2.0–7.5) |
| Gastrocnemius length, º | 6.5 (5.0–11.0) | 8.5 (5.0–13.5) | 0.077* | 2.0 (–2.0–6.0) |
| Soleus length, º | 15.0 (11.0–18.0) | 17.0 (12.5–20.5) | 0.005* | 2.0 (–1.0–5.0) |
| Iliotibial band/tensor fascia lata length, º | 14.0 (7.0–20.0) | 15.0 (10.0–22.5) | 0.213* | 1.0 (–2.5–4.5) |
| Lateral retinaculum, n (%) Tight | 37 (73) | 34 (66) | 0.508† | Decreased length: 3 (6) No change: 42 (82) Increased length: 6 (12) |
| Quality of movement, n (%) Good Medium Poor | 11 (21) 35 (69) 5 (10) | 29 (57) 16 (31) 6 (12) | 0.002‡ | Worsened quality: 6 (12) No change: 23 (45) Improved quality: 22 (43) |
| Fear-avoidance – Physical activity | 17.0 (15.0–20.0) | 16.0 (11.0–18.0) | 0.006* | –2.0 (–5.0–0) |
| Fear-avoidance – Work | 5.0 (0–11.0) | 2.0 (0–10.0) | 0.070* | –1.0 (–4.0–0) |
| *Tested with Wilcoxon signed ranks test. †Tested with McNemar test. ‡Tested with Marginal Homogeneity test. |
Correlation coefficients between predictor and criterion variables are shown in Table IV. Based on the bivariate significant correlations, the predictors entered in the forward regression model in which functional outcome was the criterion were changes in FABs-PA and FABs-W, changes in lateral retinaculum length, and changes in gastrocnemius length. The predictors that met the criteria to enter the forward regression model to predict change in pain were changes in FABs-PA, changes in FABs-W, and changes in gastrocnemius length.
| Table IV. Correlations coefficients between predictors and criterion change in function (activity of daily living scales) and change in pain (numeric pain rating scale). For variables of muscle strength and length, the effect of height and weight were partialed out |
| n = 51 | Change in function | Change in pain |
| Change in Fear-avoidance beliefs – Physical activity† | –0.57** | 0.51** |
| Change in Fear-avoidance beliefs – Work† | –0.06 | 0.30* |
| Change in quadriceps strength‡ | –0.001 | –0.08 |
| Change in hip abduction strength‡ | –0.10 | 0.15 |
| Change in hip external rotation strength‡ | 0.17 | –0.14 |
| Change in hamstrings length‡ | –0.13 | 0.14 |
| Change in quadriceps length‡ | –0.06 | 0.02 |
| Change in gastrocnemius length‡ | 0.43** | –0.25* |
| Change in soleus length‡ | 0.05 | 0.08 |
| Change in iliotibial band/tensor fascia lata length‡ | –0.01 | –0.14 |
| Change in lateral retinacular structures length† | | |
| Patients who increased length vs the others Patients who decreased length vs the others | 0.28* –0.29* | –0.19 0.15 |
| Change in quality of movement† | | |
| Patients who improved quality vs the others Patients who worsened quality vs the others | 0.05 0.06 | –0.09 0.15 |
| *Significant at p ≤ 0.05. **Significant at p ≤ 0.01. †Values represent Spearman (rho). ‡Values represent Pearson’s correlation coefficient (r) after height and weight were partialed out. |
Results of the forward regression on change in function (ADLS) indicated that after controlling age, sex, height and weight, the addition of change in FABs-PA and change in gastrocnemius length did improve the model fit (Table V). Patients who decreased levels of fear-avoidance beliefs about physical activity and increased the length of gastrocnemius improved function. The overall model accounted for 45% of variation in change in function. Having the controlled variables in the model, change in FABs-PA contributed for additional 24% explanation of variation in change in function, while change in gastrocnemius length added 8%. Variables change in FABs-PA and change in gastrocnemius length had beta coefficients different from zero.
| Table V. Forward regression model predicting changes in physical function in patients with patellofemoral pain syndrome (PFPS). Criterion variable = change in function (ADLS) score |
| Variables | Total R2 | ∆ R2 | df | p |
| Model 1: Age, Sex, Height, Weight | 0.12 | 0.12 | 4, 46 | 0.195 |
| Model 2: Age, Sex, Height, Weight, change in FABs-PA | 0.37 | 0.25 | 1, 45 | 0.000 |
| Model 3: Age, Sex, Height, Weight, change in FABs-PA, change in gastrocnemius length | 0.45 | 0.08 | 1, 44 | 0.019 |
| | B | Beta | p |
| Age | | 0.11 | 0.06 | 0.593 |
| Sex | | 0.56 | 0.02 | 0.925 |
| Height | | –0.49 | –0.31 | 0.112 |
| Weight | | –0.05 | –0.05 | 0.788 |
| Change in FABs–PA | | –1.17 | –0.45 | 0.000 |
| Change in gastrocnemius length | | 0.71 | 0.31 | 0.019 |
| FABs-PA: fear-avoidance beliefs about physical activity;ADLS: Activity of Daily Living Scale of the Knee Outcome Survey |
The results of the forward regression on change in pain (NPRS) indicated that when age, gender, height and weight were controlled, the addition of changes in FABs-PA and FABs-W contributed to the fit of the model (Table VI). Patients who decreased levels of fear-avoidance both about physical activity and about work also decreased pain. The overall model accounted for 43% of the variation in change in pain. The addition of change in FABs-PA and change in FABs-W accounted for increments in the explanation of the variation of change in pain in the order of 28% and 10%, respectively. The regression models had variance inflation factors less than 10, indicating no multicollinearity. Visual observation of residuals plots revealed that the data fit the linear model assumptions.
| Table VI. Forward regression model predicting changes in pain in patients with patellofemoral pain syndrome. Criterion variable = change in pain (numeric pain rating scale) score |
| Variables | Total R2 | ∆ R2 | df | p |
| Model 1: Age, Sex, Height, Weight | 0.05 | 0.05 | 4, 45 | 0.708 |
| Model 2: Age, Sex, Height, Weight, change in FABs-PA | 0.33 | 0.28 | 1, 44 | 0.000 |
| Model 3: Age, Sex, Height, Weight, change in FABs-PA, change in FABs-W | 0.43 | 0.10 | 1, 43 | 0.010 |
| | B | Beta | p |
| Age | | 0.02 | 0.09 | 0.473 |
| Sex | | –0.31 | –0.08 | 0.663 |
| Height | | –0.001 | –0.004 | 0.983 |
| Weight | | 0.01 | 0.07 | 0.734 |
| Change in FABs–PA | | 0.15 | 0.46 | 0.000 |
| Change in FABs-W | | 0.09 | 0.34 | 0.010 |
| FABs-PA: fear-avoidance beliefs about physical activity; FABs-W: fear-avoidance beliefs about work. |
DISCUSSION
The results of this study only partially supported our hypothesis that several changes in physical impairments targeted during rehabilitation would predict changes in function and pain. The only change in physical impairment that predicted change in function, but not change in pain, was change in gastrocnemius length. However, it explained only a small proportion of the variance (10%) in functional outcome compared with change in fear-avoidance beliefs about physical activity, which explained a larger proportion of the variance in outcome (24% and 28% of change in function and pain, respectively).
The findin≤g that the FABs-PA was the strongest predictor in this study was unexpected. We tested the association between changes in fear-avoidance beliefs and outcome of function and pain based on our clinical observations that led to believe that the behavior of patients with PFPS could fit the fear-avoidance model (28).The fear-avoidance model was originally proposed to describe how psychosocial factors influence the development of chronic low back pain. The model suggests that individual’s response to pain may fall somewhere along a continuum between 2 extremes: confrontation or avoidance (28, 29). The confronter is likely to view pain as an annoyance and temporary, and is therefore prepared to confront it. The confronter is motivated to return to work and normal activities, and thus achieves complete recovery. The avoider responds to painful stimuli by avoiding activities anticipated to cause pain. Avoidance may result in poor behavioral performance, reduced activity levels, overstated pain perception, and lead to increased disability (23, 28, 29). Although the fear-avoidance models have been validated in cross-sectional and longitudinal studies for patients with chronic and acute low back pain (16, 17, 23, 30), as well as in a variety of chronic musculoskeletal pain conditions in primary health care, work related neck-shoulder pain, and cervical spine pain (15, 31, 32), to the best of our knowledge the fear-avoidance model was never studied in patients with PFPS.
The reduction in FABs-PA in our study was smaller than the reductions reported in studies of patients with low back pain that used specific interventions to target FABs (16, 17). This observation indicates that, although our standardized physical therapy program may have helped participants to overcome their fear of physical activity to a small degree, implementation of specific programs to address FABs may produce larger effects on fear and consequently on physical function. In our study the mean reduction in FABs-PA was 2.1 points (95% confidence interval (CI) 0.6; 3.7), p = 0.007. Woby et al. (17) treated patients with chronic low back pain using 5 group sessions of problem-solving techniques to progress patients to perform new and more difficult tasks, and reported that participants decreased an average of 3.7 points in the FABs-PA. George et al. (16) randomized participants with acute low back pain to receive either a standard physical therapy program or a fear-avoidance-based physical therapy that combined education and graded exercises. They reported no significant change (average decrease of 0.4 points) in the FABs-PA for participant in the standard physical therapy group and an average decrease of 4.4 points in the FABs-PA following the fear-avoidance-based physical therapy. In this study, whereas significant reductions were observed in FABs-PA, no significant changes occurred on FABs-W. Woby et al. (17) have shown a similar finding in patients with chronic back pain: while significant reduction was only observed in FABs-PA, both changes in FABs-PA and FABs-W predicted changes in disability.
The standardized physical therapy program used in this study may have contributed to the small reduction in FABs-PA by using functional exercises such as the double leg squats and the unilateral step-down, which are activities generally feared by patients with PFPS, and we have gradually progressed these exercises from easy performance (small degrees of knee flexion) to a more difficult one (larger degrees of knee flexion). In addition, the physical therapists were instructed to perform and progress the exercises regardless of mild complaints of pain. Therefore, some of the strategies proposed to decrease FABs may have been included in our standard program. We believe that if additional strategies to overcome FABs are used in patients with PFPS it may result in larger decreases in FABs-PA.
In patients with low back pain several methods have been used effectively to reduce FABs-PA. Specific education philosophies have educated patients in issues such as: back pain is a common condition that does not require overprotection, return to activities is indicated, and the difference between hurt and harm (33). Cognitive-behavioral approaches have proposed problem-solving techniques that progress the patients to perform new tasks rated more difficult, link exercise to specific tasks, and try to problem-solve across a wide variety of work and home tasks (17, 30). Others have tried to expose patients gradually to the activity they fear the most, i.e. movement, or have used a fear-avoidance-based physical therapy that combined education and graded exercises (34). Future studies should investigate whether the methods used to overcome FABs-PA in patients with low back pain will be effective to reduce FABs-PA in patients with PFPS.
Although the majority of factors explored during this study were physical impairments commonly targeted during rehabilitation of patients with PFPS, the only physical impairment that predicted functional outcome was change in gastrocnemius length. The direction of association indicated that patients who increased length of these muscles also increased function. While improvements in gastrocnemius length were not statistically significant, the majority of patients changed above or below 1 standard error of this measure (see Table I for standard error of mean (SEM)): 26/51 (51%) decreased, 16/51 (31%) increased, and only 9/51 (18%) did not change the length of the gastrocnemius. While we do not know from our data, we speculate that perhaps the improvement in function in these patients can be explained by the fact that the elongation of the gastrocnemius may have decreased the passive resistance offered by these muscles and allowed more freedom of movement at the knee and ankle joints. The decreased stiffness could result in greater ease of motion during physical activities, which consequently could result in better function, or at least the perception of better function. The potential clinical implication of this finding is that clinicians should consider stretching the gastrocnemius muscles in an attempt to improve functional outcome.
The fact that we had complete data on 51 participants (69% of the sample) raised some concerns about the generalizability of our results. To overcome this problem and strengthen our findings we have: (i) compared the baseline characteristics of patients with complete and incomplete data and have shown that they are similar. Although not statistically significant, the participants from which we had incomplete data seemed heavier (81 ± 16 kg) than the ones with complete data (74 ± 15 kg). We do not believe this difference is likely to introduce bias since the calculated body mass index for both groups are 26 ± 0.4 kg/m2 and 28 ± 0.4 kg/m2, respectively, which would classify both groups as overweight (defined as having a body mass index in excess of 25 kg/m2). Not only both groups fit the same classification, but the overall sample seems to represent the actual trend in the USA, where between 60% and 65% of the population is classified as overweight (35). Furthermore, the observed difference in weight is not likely to impact the results regarding FABs, since weight had no effect on function and pain, as depicted in Tables V and VI; (ii) repeated the regression models using the 60 participants (81% of the sample) to which we had incomplete data on physical impairments. The results of the analysis with 60 participant were very similar the results with the 51 participants. When functional outcome was the criterion, age, sex, height and weight accounted for 10% of variation in change in function, and change in FABs-PA added 27 more percentage points (R2 for overall model = 0.37). When pain outcome was the criterion, age, gender, height and weight accounted for 5% of the variation in change in pain, and changes in FABs-PA added 29% on the explanation of pain outcome (R2 for overall model = 0.34). On the other hand, we acknowledge that among patients with complete data, patients with marked chronicity of pain (> 25months) were under-represented, which may influence the generalizability of the results.
Although some may question the appropriateness of treating the criterion variables changes in physical function and pain as continuous ones, we defend our approach because the changes in ADLS and NPRS: (i) were normally distributed; (ii) represented a large range of scores with sufficient distinct values. For our analysis, change in the ADLS generated 31 distinct values, whereas change in NPRS generated 21 distinct values. Furthermore, the robustness of our findings using regression models for continuous outcomes was checked by using logistic regression. Briefly, we first dichotomized the criterion variables using the minimum clinical important difference for the ADLS and NPRS reported previously (36), which resulted in 33/51 (65%) and 29/51 (57%) of individuals showing clinically important improvements in the ADLS and NPRS, respectively. Based on non-parametric bivariate associations, the variables entered in the model to predict changes in ADLS were changes in FABs-PA and gastrocnemius length, whereas the variables entered to predict changes in NPRS were changes in FABs-PA and changes in FABs-W. Results of the logistic regression indicated that after controlling for age, sex, height and weight (not significant predictors), changes in FABs-PA (odds ratio (OR): 0.83, (95% CI: 0.69; 0.98)) and gastrocnemius length (OR: 1.18, (95% CI: 1.01; 1.36)) predicted changes in ADLS, whereas changes in FABs-W was the only significant predictor (OR: 0.82, (95% CI: 0.69; 0.98)) of changes in NPRS (changes in FABs-PA just missed significance (p = 0.057)).
An unexpected result of the present investigation was the lack of association between changes in muscle strength and muscle length and outcome. Because for the majority of the impairment variables a reasonable proportion of individuals did change, we do not believe the lack of association may be due to low variability in the data. We investigated the association between changes in impairments and outcomes of function and pain based on studies that demonstrated that patients with PFPS who performed strengthening and flexibility exercises also improved function and pain (37, 38). However, these studies have never tested if the patients who increased muscle strength or muscle length also improved function and decreased pain. We are not aware of any study that investigated the relationship of changes in muscle strength and changes in pain and function. One study investigated the correlation between function and muscle weakness in a cross-sectional study and reported that the association was not significant (39).
Our final regression models explained less than half of the variation in the outcome of function and pain. We believe other factors may exist that contribute to function and pain outcome in this population that have not been investigated. As FABs were not the main focus of our research, we failed to test how changes in other psychological factors, which may or may not be part of the fear-avoidance model, relate to rehabilitation outcome in patients with PFPS. In addition, we highlight that the study design (one group pre-post), although appropriate for our aim to identify changes in impairments associated with changes in function and pain, is not appropriate to draw conclusions about the effectiveness of the rehabilitation program. Lastly, although we make the argument that changes in FABs may impact changes in function and pain, we cannot conclude from our study, which only investigated the associations between changes in several factors during intervention, that the results may in fact indicate the reverse: that the changes in physical function and pain due perhaps to the success in the therapy may lead to changes in FABs. We believe the results of this study points out alternative areas of research that may contribute to a better management of PFPS.
In conclusion, this study indicates that, in our sample of patients with PFPS, change in FABs-PA was the strongest predictor of function and pain outcomes. The fact that patients who decreased their FABs improved function and decreased pain indicates that perhaps FABs should be specifically targeted during the treatment of patients with PFPS. It is possible that strategies used to overcome FABs may be beneficial in the rehabilitation of these patients.
ACKNOWLEDGEMENTS
This study was supported by the Clinical Research Grant Program of Orthopaedic Section of American Physical Therapy Association, and Pennsylvania Physical Therapy Association Research Fund.
Orthopedic Physical Therapy Products (OPTP) and Endura-tape (Endura-tape Pty Ltd- Sydney, Australia) provided the EnduraSPORTS Tape and the EnduraFIX Tape used during treatment of patients in this study.
REFERENCES