OBJECTIVE: To assess the relationship between the severity of neurogenic bowel and health-related quality of life in persons with various degrees of spinal cord injury.
DESIGN: Cross-sectional.
SUBJECTS: A total of 128 people with spinal cord injury.
METHODS: Two questionnaires were sent out by post. One included demographic characteristics and a neurogenic bowel dysfunction score to evaluate the severity of neurogenic bowel dysfunction. The other was a Short-Form 36-Item Health Survey that evaluated the quality of life in persons with spinal cord injury.
RESULTS: Approximately half of the persons with spinal cord injury (46.9%) had moderate to severe degrees of neurogenic bowel dysfunction, the severity of which was associated with the physical functioning and physical component summary score in health-related quality of life. The results also showed that more severe neurological classifications led to lower physical component summary scores for impaired physical function and bodily pain. There was no correlation between the length of time elapsed since injury and health-related quality of life. Persons with more severe neurogenic bowel conditions were also found to be more likely to receive rehabilitative therapy.
CONCLUSION: Neurogenic bowel dysfunction is associated with health-related quality of life expression in persons with spinal cord injury, especially in physical functioning and physical component summary.
Key words: spinal cord injury, neurogenic bowel, health-related quality of life.
J Rehabil Med 2009; 41: 35–40
Correspondence address: Mao-Hsiung Huang, Department of Physical Medicine and Rehabilitation, Kaohsiung Medical University Hospital, No 100 Tzyou 1st Rd, Kaohsiung 807, Taiwan. E-mail: maohuang@ms24.hinet.net
Submitted November 25, 2007; accepted July 2, 2008
INTRODUCTION
It is well known that spinal cord injury (SCI) can result in a significant challenge to health-related quality of life (HRQL) (1). As the average life expectancy of people with SCI has increased due to improvements in medicine, the HRQL of persons with SCI should be examined more thoroughly because quality of life (QoL) provides a good prediction of survival 15 years after injury (2). As a result, many studies have discussed a number of QoL issues for persons with SCI, including age, gender, level of injury, time since injury and cause of injury (3–7). In addition, other research has focused on QoL issues in people with SCI, such as social life, environment, finance and employment (8–12). However, less research has mentioned the influences of QoL when additional complicating medical problems are present, such as neurogenic bowel problems, neurogenic pain, spasticity, pressure sores, neurogenic bladder and sexual dysfunction (13, 14).
A large majority of persons with SCI who have neurogenic bowel problems suffer from constipation and faecal incontinence, often resulting in impaired QoL. A previous study showed that constipation can be a cause of hospitalization among persons with SCI in the chronic stage (15). Glickman & Kamm (14) found that nausea, diarrhoea, constipation and faecal incontinence were all much more common (p < 0.001) after SCI. Liem et al. (16) pointed out that constipation (47.9%), diarrhoea (41.8%) and pressure ulcers (38.7%) were common medical complications in persons with SCI. It was also reported that 58% of persons with a complete SCI above level L2 suffered from constipation (17). Clearly, bowel dysfunction is a major physical and psychological problem in persons with SCI.
Other ways of measuring bowel function have been used for the clinical assessment of constipation or faecal incontinence in other patient groups (18–20). However, these scores were not valid in persons with SCI as the scores could not be evaluated in people with both constipation and faecal incontinence. Although Westgren & Levi (13) found that QoL for persons with SCI with or without neurogenic bowel dysfunction (NBD) varied greatly, it was still unclear how and to what extent degrees of severity of NBD impact on a person’s QoL. In contrast to previous means of evaluating bowel dysfunction, Krogh et al. (21) developed and validated a newly standardized symptom-based test as a measure by which the severity of neurogenic bowel can be quantitatively measured. This NBD score has been shown to be reproducible in persons with SCI who have either constipation and faecal incontinence or a combination of both (22).
The severity of NBD and its impact on social activities and QoL has rarely been thoroughly studied among persons with SCI. The aim of this study was to assess the correlation between the severity of NBD and each component of HRQL in people with SCI. In addition, the correlation between the severity of NBD and the severity of cord injury, duration of cord injury, and intervention of rehabilitation were also analysed.
METHODS
Participants
Responses were collected from all 214 persons with an International Classification of Diseases-9 (ICD-9) diagnosis of SCI, who were admitted to the rehabilitative department of a medical centre in southern Taiwan between 2002 and 2006. The following reasons were considered grounds for exclusion: (i) less than one year since injury, in order to avoid spinal shock status; (ii) diagnosis of cauda equina lesion; (iii) having other diseases involving cognitive deficit; (iv) use of mechanical ventilation; (v) head injury or multiple traumas. A total of 196 persons meeting the criteria were recruited and they were sent 2 detailed questionnaires describing HRQL and NBD score. The respondents were instructed to answer the questionnaires by themselves or, if necesary, seek help. Of these respondents, 24 had a high-level cord injury and needed help filling in their answers.
Measures
The 2 questionnaires comprised descriptions of QoL and bowel function as well as some demographic information including age, gender, severity of SCI, level of SCI, time since injury, cause of injury, and continual participation or not in rehabilitation.
QoL was measured in this study by the Short-Form 36 Health survey (SF-36), a common instrument used to assess HRQL. It consists of 36 questions and is organized into 8 health domains: Physical Functioning (10 items), Role Physical (4 items), Bodily Pain (2 items), General Health (5 items), Vitality (4 items), Social Functioning (2 items), Role Emotional (3 items) and Mental Health (5 items). A further question about persons’ perception of their previous health condition was not included. Each domain score is transformed into a scale with a range from 0 to 100, with higher scores indicating better health status (23). The second-order scores, the Physical Component Score (PCS) and Mental Component Score (MCS), which were derived from the above 8 scores, can provide the opportunity for more detailed interpretations (24). For the Taiwanese version of the SF-36, acceptable internal consistencies (Cronbach’s alpha coefficient greater than 0.70 for all domains) have been reported (25). The previous study demonstrated that the psychometric testing of the Chinese (Taiwan) SF-36 survey, satisfied most conventional psychometric criteria and could be used for HRQL measures in Taiwan (25).
Each respondent’s bowel condition was assessed using the newly developed NBD score (21). This score contained 10 items, including frequency of defecation (0–6 points), time used for each defecation (0–7 points), uneasiness or headache or perspiration during defecation (0–2 points), regular use of tablets for constipation (0–2 points), regular use of drops for constipation (0–2 points), digital stimulation or evacuation of the anorectum (0–6 points), frequency of faecal incontinence (0–13 points), medication against faecal incontinence (0–4 points), flatus incontinence (0–2 points) and perianal skin problems (0–3 points). Each symptom of NBD is weighted according to its impact on QoL. The total NBD score ranged from 0 to 47, with a higher score indicating more severe bowel symptoms. The levels of severity of NBD were divided into 4 subgroups: very minor dysfunction (NBD score 0–6), minor dysfunction (NBD score 7–9), moderate dysfunction (NBD score 10–13) and severe dysfunction (NBD score ≥ 14). A Chinese version of the questionnaire was not available, so a forward-backward translation procedure was performed in co-operation with professional translators (26, 27).
Statistical methods
Data analysis was conducted using SPSS version 12.0. The data were entered twice in order to minimize typing errors. For descriptive purposes, data were presented as means with standard deviations in the results of SF-36. The reliability of the SF-36 survey was evaluated using Cronbach’s α. The relationships between NBD score and the neurological classification were tested by χ2 tests, with a p-value less than 0.05 taken to indicate a statistically significant result. Pearson’s correlation coefficients were computed to show the linear relationship between the NBD score and HRQL. The results were then analysed to determine whether there were any associations between the severity of NBD and the scores of the 8 domains and the second-order scores (PSC and MCS) via analysis of variance (ANOVA). Furthermore, the interactions of various clinical and demographic variables on QoL were investigated by the ANOVA or 2-sample t-test. The General Linear Models (GLM) were used to evaluate the significance of interactions with factors such as the American Spinal Injury Association/ International Medical Society of Paraplegia (ASIA/IMSOP) neurological classification (12, 28), time since injury, and continual participation in rehabilitation (yes or no) while adjusting for sex and age. A p-value of less than 0.05 was taken to indicate statistical significance.
RESULTS
A total of 128 persons responded (response rate approximately 60%). There was no statistically significant difference between the response group and the non-response group with regard to age, gender, severity of SCI, level of spinal cord lesion, or time since injury.
Of the 128 respondents, age range 13–84 (mean age 48.3) years, 95 were men (74.2%) and 33 were women (25.8%). Participants were assigned to 3 groups based on level and completeness of the lesion in accordance with the ASIA/ IMSOP classification. Thirty-six persons had tetraplegia ASIA A, B, C (28.1%), 58 persons had paraplegia ASIA A, B, C (45.3%), and 34 persons had paresis ASIA D (26.6%). Time since injury was divided into 1–2 years (32.1%), 3–5 years (21.9%), 6–10 years (16.4%) and over 10 years (29.6%). These conditions were caused by either vehicular accidents (56.3%), falls (25.8%), sports (3.1%), violence (3.1%) or other causes (11.7%). Sixty-nine persons (53.9%) were regularly undergoing rehabilitation, in contrast to 59 persons (46.1%) who had already ceased rehabilitation.
The statistical summary for SF-36 domains and second-order scores in persons with SCI is presented in Table I. Individually, Cronbach’s alpha coefficient was 0.89 in Physical Functioning, 0.83 in Role Physical, 0.76 in Bodily Pain, 0.77 in General Health, 0.81 in Vitality, 0.71 in Social Functioning, 0.82 in Role Emotional, and 0.84 in Mental Health. It revealed acceptable internal consistencies. In addition, the percentages of respondents achieving either the highest score (ceiling) or the lowest score (floor) were presented as a large ceiling or floor effect, which will limit the ability of SF-36 to detect change over time (29). In this study, there were some floor effects (> 10% of the sample) in “physical function” (12.5%), “role physical” (17.2%) and “role emotional” (21.9%). There was only one ceiling effect for “role emotional” (18.8%) and all the other floor or ceiling effects were negligible.
| Table I. SF-36 domain and component in the patients (n = 128) |
| Statistics | PF | RP | BP | GH | VT | SF | RE | MH | PCS | MCS |
| Mean (SD) | 19 (22) | 17 (31) | 42 (20) | 42 (22) | 45 (21) | 48 (26) | 31 (39) | 55 (21) | 29 (7) | 43 (12) |
| Range | 0–100 | 0–100 | 0–90 | 0–92 | 0–85 | 0–100 | 0–100 | 0–92 | 16–53 | 17–68 |
| Ceiling, % | 0.7 | 7.8 | 0.0 | 0.0 | 0.0 | 2.3 | 18.8 | 0.0 | – | – |
| Floor, % | 12.5 | 17.2 | 3.9 | 6.3 | 1.6 | 5.5 | 21.9 | 0.7 | – | – |
| PF: Physical Functioning; RP: Role Physical; BP: Bodily Pain; GH: General Health; VT: Vitality; SF: Social Functioning; RE: Role Emotional; MH: Mental Health; PCS: Physical Component Summary; MCS: Mental Component Summary; SD: standard deviation; SF-36: Short-Form 36 Health survey. |
Table II illustrates the relationship between the severity of NBD and the neurological classification in persons with SCI. There appears to be a correlation between the severity of the impairment and the severity of the NBD score, with approximately 68% of subjects in the paresis ASIA D group being in the very minor severity NBD group, compared with the most severe tetraplegia ASIA A, B, C group having more than half of the subjects (53%) suffering from severe bowel dysfunction. There were significantly different distributions of severity of NBD across various neurological classifications (p = 0.001).
| Table II. Distribution and relationship between neurogenic bowel dysfunction (NBD) score and neurological classification |
| | Total | Very minor (NBD 0–6) n (%) | Minor (NBD 7–9) n (%) | Moderate (NBD 10–13) n (%) | Severe (NBD ≥ 14) n (%) | χ2 p-value |
| Neurological classification |
| Tetraplegia: ASIA A, B, C | 36 | 6 (17) | 8 (22) | 3 (8) | 19 (53) | 0.001 |
| Paraplegia: ASIA A, B, C | 58 | 16 (28) | 7 (12) | 13 (22) | 22 (38) | |
| All levels: ASIA D | 34 | 23 (68) | 8 (23) | 2 (6) | 1 (3) | |
| The χ2 test was used to investigate the relationship between NBD score and neurological classification in spinal cord injured patients (n = 128). ASIA: American Spinal Injury Association. |
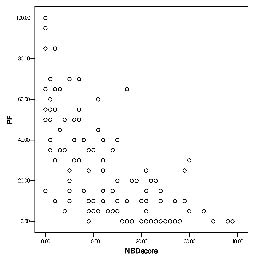
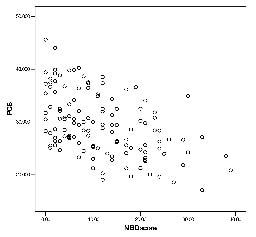
The SF-36 scores in persons with SCI with various NBD severities are shown in Table III and significant hierarchical differences can be seen in PF and PCS. Persons with a very minor NBD had the highest scores, in contrast to persons with severe NBD who had the lowest scores. The largest gap was found between the very minor NBD and the minor NBD rather than between the moderate and severe subgroups in the above domains. Furthermore, Fig. 1 plots the distribution of PF values and their correlation with their NBD scores. There is a significant relation between the NBD score and physical functioning (r = –0.70, p-value < 0.001). Fig. 2 reveals the distribution of PCS and their correlation with NBD score. There is also a significant correlation between the NBD score and the PCS (r = –0.58, p-value < 0.001). This means that participants with worse NBD are likely to have less PF and PCS. There are no obvious associations between the NBD score and other SF-36 domains, including the MCS.
| Table III. Comparisons in quality of life in patients with various neurogenic bowel dysfunction (NBD) severity |
| NBD subgroups | n | PF Mean (SD) | RP Mean (SD) | BP Mean (SD) | GH Mean (SD) | VT Mean (SD) | SF Mean (SD) | RE Mean (SD) | MH Mean (SD) | PCS Mean (SD) | MCS Mean (SD) |
| Very minor | 45 | 29 (25) | 26 (36) | 45 (17) | 44 (30) | 44 (19) | 49 (29) | 34 (42) | 53 (21) | 32 (6) | 41 (12) |
| Minor | 23 | 17 (19) | 19(33) | 42 (24) | 43 (21) | 47 (19) | 48 (22) | 18 (24) | 53 (18) | 28 (8) | 42 (10) |
| Moderate | 18 | 16 (19) | 9 (12) | 40 (19) | 41 (24) | 53 (23) | 55 (25) | 49 (41) | 61 (21) | 27 (7) | 48 (12) |
| Severe | 42 | 12 (18) | 14 (30) | 39 (22) | 41 (19) | 44 (22) | 44 (25) | 27 (39) | 54 (23) | 27 (7) | 42 (12) |
| p-value* | | < 0.001 | 0.31 | 0.52 | 0.93 | 0.42 | 0.51 | 0.09 | 0.62 | < 0.001 | 0.18 |
| *p-values were computed by General Linear Model (GLM) with sex and age as adjusted variables. PF: Physical Functioning; RP: Role Physical; BP: Bodily Pain; GH: General Health; VT: Vitality; SF: Social Functioning; RE: Role Emotional; MH: Mental Health; PCS: Physical Component Summary; MCS: Mental Component Summary; SD: standard deviation. |
Fig. 1. Distribution of neurogenic bowel dysfunction (NBD) score and physical functioning (PF), and their correlation (r = –0.70, p-value < 0.001).
Fig. 2. Distribution of neurogenic bowel dysfunction (NBD) score and physical component summary (PCS), and their correlation (r = –0.58, p-value < 0.001).
ASIA/IMSOP neurological classification differences were seen in PF, BP as well as PCS (Table IV). Persons with paresis ASIA D had the highest scores and persons with tetraplegia A, B, C had the lowest scores in the above domains. The remaining domains and MCS showed no significant differences. When investigating the impact of time since injury, no difference in HRQL was found in all SF-36 domains and PCS and MCS. Participation in rehabilitation was significantly associated with PF, BP and PCS (Table IV). Interestingly, persons who were not receiving rehabilitation had higher scores than those who continually participated in rehabilitation.
| Table IV. Comparison of each component of SF-36 in persons (n=128) with different severities of neurological injury and rehabilitation intervention |
| | n | PF Mean (SD) | RP Mean (SD) | BP Mean (SD) | GH Mean (SD) | VT Mean (SD) | SF Mean (SD) | RE Mean (SD) | MH Mean (SD) | PCS Mean (SD) | MCS Mean (SD) |
| Neurological classification |
| Tetraplegia A,B,C | 36 | 6 (15) | 10 (21) | 35 (22) | 42 (23) | 45 (21) | 39 (25) | 26 (37) | 58 (22) | 24 (5) | 44 (11) |
| Paraplegia A,B,C | 58 | 20 (18) | 19 (32) | 43 (20) | 44 (22) | 47 (21) | 44 (24) | 32 (40) | 55 (20) | 29 (7) | 44 (12) |
| All level D | 34 | 33 (27) | 21 (36) | 46 (18) | 39 (21) | 42 (19) | 46 (25) | 36 (42) | 51 (22) | 33 (7) | 40 (13) |
| p-value # | | < 0.001 | 0.24 | 0.03 | 0.64 | 0.55 | 0.08 | 0.55 | 0.39 | < 0.001 | 0.31 |
| Continual rehabilitation |
| Yes | 69 | 15 (17) | 15 (29) | 38 (18) | 42 (22) | 47 (21) | 45 (27) | 29 (39) | 56 (22) | 27 (6) | 43 (12) |
| No | 59 | 25 (26) | 19 (33) | 47 (22) | 42 (21) | 44 (20) | 51 (25) | 33 (41) | 53 (20) | 31 (8) | 42 (12) |
| p-value* | | 0.01 | 0.44 | 0.02 | 0.81 | 0.39 | 0.19 | 0.58 | 0.37 | 0.002 | 0.48 |
| *p-values were computed by General Linear Model (GLM) with sex and age as adjusted variables. PF: Physical Functioning; RP: Role Physical; BP: Bodily Pain; GH: General Health; VT: Vitality; SF: Social Functioning; RE: Role Emotional; MH: Mental Health; PCS: Physical Component Summary; MCS: Mental Component Summary; SD: standard deviation; SF-36: Short-Form 36 Health survey. |
DISCUSSION
Bowel dysfunction caused major restrictions in social activities and in the QoL in 39% of persons with SCI. This was regarded as a greater problem than both bladder and sexual dysfunction (29) and NBD clearly plays an important role and greatly affects a person’s QoL. Although Westgren & Levi (13) pointed out that having a neurogenic bowel may have a marked impact on QoL, there was a big difference in HRQL between the subjects with and without a neurogenic bowel. As a result, a more detailed description of the degrees of severity of NBD and how it relates to QoL issues needs to be provided.
According to our findings, NBD is a very common complication among persons with SCI. We found that nearly half of the persons with SCI (46.9%) had moderate to severe degrees of NBD. Only one-third of the persons (35.2%) with SCI had very minor bowel dysfunction. Furthermore, our study revealed that subjects with more severe NBD became obviously worse in PF and in PCS. The 10-item PF sub-scale focuses on physical disability, which is a reflection of a subject’s level of activity (30). It showed that subjects with more severe NBD were more physically disabled in their daily living than the subjects with less severe NBD. The severity of NBD was associated with physical QoL. We noted negative linear relations between the NBD scores and PF as well as PCS (Figs 1 and 2). We also found that these hierarchical scores were presented in sequence and that the biggest discriminative gap was located between the very minor NBD and the minor NBD groups (Table III). There were only minor differences among the other groups, suggesting that the presence of NBD would have a predictive value of physical quality. However, once persons had suffered from neurogenic bowel problems, even in various degrees of severity, they would not experience a very significant difference in HRQL.
Compared with a previous study discussing bowel problems and QoL in persons with SCI (13), there was no significant difference in mental domains and MCS in our SCI population. It demonstrated that persons with SCI with NBD had a greater influence on PCS than on MCS. Future research should be directed at developing effective training programmes to address neurogenic bowel problems in persons with SCI in order to enhance their physiological status.
Fuhrer et al. (5) also demonstrated that the life satisfaction of persons with SCI appeared not to be influenced by their degree of impairment or disability Post and colleagues (6) pointed out that the level of social and psychological functioning is a more important predictor of life satisfaction than is the seriousness of the injury. However, we found a strong correlation between the PCS and the neurological classification in our SCI study population. Subjects with paresis had the highest PCS scores while subjects with paraplegia scored higher than those with tetraplegia. The neurological classification played an important role on HRQL, especially in PF, BP, as well as PCS. On the other hand, no significant correlation was observed between neurological classification and MCS scores. This meant that various impairment levels did not matter in the mental and psychological status of persons with SCI. We also found that PCS and MCS provided different ways to measure HRQL among persons with SCI. As there was a strong correlation between neurological classification and severity of NBD, the neurological classification could be used as an indicator for predicting bowel conditions in persons with SCI.
It is worth noting that persons in our study who were not receiving rehabilitation had higher PF, BP, and PCS scores than those who were participating in rehabilitation. Through further evaluation, we found out that neurological classification seemed to be a determining factor in this result. Persons with a more severe neurological level (tetraplegia A, B, C group) had a significantly higher level of representation in the rehabilitative program than the paraplegia A, B, C group and the paresis D group (p = 0.001). Perhaps this meant that subjects who were in poorer physical condition or suffered from greater pain had a stronger motivation to participate in the rehabilitative program. We also tried to examine the impact of time since injury on HRQL. However, similar to the findings of previous research (11, 31), we did not find time since injury to be obviously related to QoL either in PCS or in MCS.
There are some potential limitations to our study. First, only approximately 60% of the persons we originally approached responded to our request to complete the survey.
However, retrospective analysis of the basic data from their past admissions charts revealed no significant differences compared with the subjects who responded to our request to complete the survey. Although no statistically significant differences were detected between the response and non-response groups, there was a potential for bias in seeking responses by post, as respondents may have had a better health status than those who did not respond (32). Secondly, this study lacked a matched control group. It would have been better to use the general population as a control group for HRQL. However, the results of this study give us a general baseline HRQL for persons with SCI. Our findings clarified the relationships between severity of NBD and QoL in persons with SCI.
In conclusion, nearly half of the persons with SCI (49.6%) had moderate to severe degrees of NBD problems, and there is a significant correlation between the severity of NBD and HRQL, which clearly focuses on PF and PCS. Increased societal awareness of this problem and further management for persons with SCI may be needed.
ACKNOWLEDGEMENTS
We would like to thank the National Science Council for their financial support. In addition, we would also like to thank Mr James Fenton for his assistance with editing.
REFERENCES
1. Dijkers M. Quality of life after spinal cord injury: a meta analysis of the effects of disablement components. Spinal Cord 1997; 35: 829–840.
2. Krause JS, Kjorsvig JM. Mortality after spinal cord injury: a four year prospective study. Arch Phys Med Rehabil 1992; 73: 558–563.
3. Putzke JD, Richards JS, Hicken BL, DeVivo MJ. Predictors of life satisfaction: a spinal cord injury cohort study. Arch Phys Med Rehabil 2002; 83: 555–561.
4. Kennedy P, Rogers B. Reported quality of life of people with spinal cord injuries: a longitudinal analysis of the first 6 months post-discharge. Spinal Cord 2000; 38: 498–503.
5. Fuhrer MJ, Rintala DH, Hart KA, Clearman R, Young ME. Relationship of life satisfaction to impairment, disability and handicap among persons with spinal cord injury living in the community. Arch Phys Med Rehabil 1992; 73: 552–557.
6. Post MW, De Witte LP, Van Asbeck FW, Van Dijk AJ, Schrijvers AJ. Predictors of health status and life satisfaction in spinal cord injury. Arch Phys Med Rehabil 1998; 79: 395–401.
7. Clayton KS, Chubon RA. Factors associated with the quality of life of spinal cord injured persons. Arch Phys Med Rehabil 1994; 75: 633–638.
8. Dijkers M. Correlates of life satisfaction among persons with spinal cord injury. Arch Phys Med Rehabil 1999; 80: 867–876.
9. Richards JS, Bombardier CH, Tate D, Dijkers M, Gordon W, Shewchuk R, et al. Access to the environment and life satisfaction after spinal cord injury. Arch Phys Med Rehabil 1999; 80: 1501–1506.
10. Gerhart KA, Weitzenkamp DA, Kennedy P, Glass CA, Charlifue SW. Correlates of stress in long-term spinal cord injury. Spinal Cord 1999; 37: 183–190.
11. Lund ML, Nordlund A, Nygard L, Lexell J, Bernspang B. Perceptions of participation and predictors of perceived problems with participation in persons with spinal cord injury. J Rehabil Med 2005; 37: 3–8.
12. Elfström ML, Rydén A, Kreuter M, Taft C, Sullivan M. Relations between coping strategies and health-related quality of life in patients with spinal cord lesion. J Rehabil Med 2005; 37: 9–16.
13. Westgren N, Levi R. Quality of life and traumatic spinal cord injury. Arch Phys Med Rehabil 1998; 79: 1433–1439.
14. Glickman S, Kamm MA. Bowel dysfunction in spinal-cord-injury patients. Lancet 1996; 347: 1651–1653.
15. Gore RM, Mintzer RA, Calenoff L. Gastrointestinal complications of spinal cord injury. Spine 1981; 6: 538–544.
16. Liem NR, McColl MA, King W, Smith KM. Aging with a spinal cord injury: factors associated with the need for more help with activities of daily living. Arch Phys Med Rehabil 2004; 85: 1567–1577.
17. De Looze D, Van Laere M, De Muynck M, Beke R, Elewaut A. Constipation and other gastrointestinal problems in spinal cord injury patients. Spinal Cord 1998; 36: 63–66.
18. Vaizey CJ, Carapeti E, Cahill JA, Kamm MA. Prospective comparison of fecal incontinence grading systems. Gut 1999; 44: 77–80.
19. Agachan F, Chen T, Pfeiffer J, Reisman P, Wexner SD. A constipation scoring system to simplify evaluation and management of constipated patients. Dis Colon Rectum 1996; 39: 681–685.
20. Knowles CH, Eccersley AJ, Scott SM, Walker SM, Reeves B, Lunniss PJ. Linear discriminant analysis of symptoms in patients with chronic constipation. Dis Colon Rectum 2000; 43: 1419–1426.
21. Krogh K, Christensen P, Sabroe S, Laurberg S. Neurogenic bowel dysfunction score. Spinal Cord 2006; 44: 625–631.
22. Christensen P, Bazzocchi G, Coggrave M, Abel R, Hultling C, Krogh K, et al. A randomized controlled trial of transanal irrigation versus conservative bowel management in spinal cord-injured patients. Gastroenterology 2006; 131: 738–747.
23. Ware JE, Sherbourne CD. The MOS 36-item short form health survey (SF-36): I. conceptual framework and item selection. Med Care 1992; 30: 473–483.
24. Forchheimer M, McAweeney M, Tate DG. Use of the SF-36 among persons with spinal cord injury. Am J Phys Med Rehabil 2004; 83: 390–395.
25. Fuh JL, Wang SJ, Lu SR, Juang KD, Lee SJ. Psychometric evaluation of a Chinese (Taiwanese) version of the SF-36 health survey amongst middle-aged women from a rural community. Qual Life Res 2000; 9: 675–683.
26. Hilton A, Skrutkowski M. Translating instruments into other languages: development and testing processes. Cancer Nurs 2002; 25: 1–7.
27. Su CT, Parham LD. Generating a valid questionnaire translation for cross-cultural use. Am J Occup Ther 2002; 56: 581–585.
28. Ditunno JF, Young W, Donovan WH, Creasey G. The international standards booklet of neurological and functional classification of spinal cord injury. Paraplegia 1994; 32: 70–80.
29. Krogh K, Nielsen J, Djurhuus JC, Mosdal C, Sabroe S, Laurberg S. Colorectal function in patients with spinal cord lesions. Dis Colon Rectum 1997; 40: 1233–1239.
30. Ware JE, Snow KK, Kosinski M, Gandek B, editors. SF-36 health survey manual and interpretation guide. Boston, MA: New England Medical Center, The Health Institute; 1993.
31. Dahlberg A, Alaranta H, Sintonen H. Health-related quality of life in persons with traumatic spinal cord lesion in Helsinki. J Rehabil Med 2005; 37: 312–316.
32. McHorney CA, Kosinski M, Ware JE. Comparisons of the costs and quality of norms for the SF-36 health survey collected by post versus telephone interview: results from a national survey. Med Care 1994; 32: 552–567.