Objective and design: The prevalence of low back pain was assessed in relation to physical activity, for both work and leisure activities, in a randomly selected population in the northern part of Sweden. Additionally, the associations between age, sex, level of education, lifestyle factors, demographic characteristics, and low back pain were evaluated.
Subjects: A total of 5798 subjects aged 25–79 years were selected randomly from a geographically well-defined area in northern Sweden.
METHODS: Additional questions concerning people’s experience of low back pain were added to the questionnaire of the World Health Organization MONICA (MONItoring of trends and determinants in CArdiovascular disease) health survey with the aim of investigating prevalence rates and factors associated with low back pain.
RESULTS: Forty-one percent of the participants reported having low back pain (of these 55% were women and 45% men). The prevalence rate was highest in the age group 55–64 years. Chronic low back pain was the most frequent occurring problem. Of those with low back pain, 43% of the women and 37% of the men reported having continuous low back pain for more than 6 months. Individuals with low back pain often experienced a more physically heavy workload at work and lower physical activity during leisure time, and they were also more likely to have been smokers, have had higher body mass index, lived in smaller communities, and were less educated than people without low back pain.
CONCLUSION: Low back pain seems to be associated with physical activity at work and in leisure time, certain lifestyle factors and demographic characteristics.
Key words: low back pain, physical activity, prevalence.
J Rehabil Med 2008; 40: 864–869
Correspondence address: Christina Björck-van Dijken,
Departments of Orthopaedics, Umeå University Hospital,
SE-901 85 Umeå, Sweden. E-mail: christina.bjorck@vll.se
Submitted May 8, 2007; accepted July 2, 2008
INTRODUCTION
Low back pain (LBP) is a major public health problem in society, which causes considerable disability and use of health services. The total cost of LBP in the USA exceeds 100 billion dollars per year (1). Most published studies on the epidemiology of back pain are from North America, Great Britain and other parts of Europe (2, 3). Surveys show different prevalence rates. Point prevalence ranges from 12% to 33%, 1-year prevalence from 22% to 65% and life-time prevalence from 11% to 84% (4). Thus, these various studies are not directly comparable due to the different nature of the questions used in each study, rather than the differences among the people studied (2, 3).
Men and women report more or less the same prevalence of back pain, although some large surveys in the UK showed a slightly higher prevalence in women (3). In Sweden, the prevalence of LBP has been about the same, approximately 30–40%, since the beginning of the 1980s. A slight increase can be seen among women and a small decrease among men, especially for severe LBP (5).
Although the prevalence has been investigated in numerous studies, there are very few studies that describe the association between LBP and levels of physical activity. From a public health perspective, it is important to know whether lifestyle factors, such as physical activity, smoking, and body weight are associated with LBP. Therefore we performed a population-based study to assess the prevalence of LBP in relation to physical activity at work and in leisure time.
METHODS
MONICA study
MONICA, an acronym for “MONItoring of Trends and Determinants in CArdiovascular Disease”, started in 1982 as an international study to monitor a number of cardiovascular risk factors in different countries and continents in parallel with cardiovascular end-points (6). The main aim of the MONICA project was to assess risk factors for cardiovascular diseases. The 2 northernmost counties in Sweden constitute together one of 39 collaborating centres in the World Health Organization (WHO) MONICA project (1990). The Northern Sweden MONICA study covers a populated area of 154,000 km, with a total population of 516,300 (in 1999) and a target population of 310,000 in the age range 25–79 years. Most of the inhabitants live in municipalities along the coastal area. In 1986, 1990, 1994 and 1999 population surveys of independent, random samples were performed. This means that the samples from 1990 to 1999 were selected irrespective of whether or not the subjects had been selected in previous surveys.
The research ethics committee of Umeå University and the national Computer Data Inspection Board approved the data handling procedures.
Sample selection and survey teams
According to the MONICA study protocol the women and men who participate should be randomly selected and stratified for sex and age, divided into 10-year age groups, 25–34, 35–44, 45–54, 55–64 and 65–74 years, and one 5-year age group, 75–79 years. For the 1999 survey, 250 women and 250 men from each age group were invited, together with subjects from the earlier surveys in 1986–1994. Thus, the Northern Sweden sample 1999 included 8356 randomly selected women and men. An updated national database was used for the selection of persons who were to be included in the population survey. A register included information on dates of birth and addresses for all residents living in the 2 counties. Every person selected was sent a letter inviting them to an examination at the nearest healthcare centre. The letter also included a questionnaire that mainly concerns sociodemographic data and cardiovascular risk factors. If the subject did not attend the examination, 2 more letters were sent with new invitations. People who still did not attend the examination were contacted by telephone or by letter to ascertain the reason for their reluctance to attend the study. The non-participants were asked to give basic information on social background and risk factors for cardiovascular disease (6).
The survey was performed by 2 operating teams, one in each county. The teams travelled to approximately 40 healthcare centres in the 2 counties. The team members were trained to ensure correctness and uniformity in the information collection. Quality assessments of the MONICA project have shown that the northern Sweden sample was one of the MONICA units with very good quality data (7).
In the MONICA survey, in the year 1999, questions about the population’s experience of LBP were added to the questions on cardiovascular risk factors. The questions for assessing LBP included prevalence of LBP (yes/no), the duration of LBP (last week, last 6 months, more than 6 months) and frequency of LBP (continuously, occasionally every month, occasionally every year). Chronic back pain was defined as LBP that had lasted continuously for more than 6 months. Physical activity within the workplace during the last year was also assessed. Four different alternatives of physical working conditions could be reported and were described to the respondents with examples from different occupations, such as: sedentary work (paperwork, mostly sitting work); light physical work (office work, teaching, shop assistant, where you walk a lot but do not lift heavy objects); moderate heavy work (carpentry, plumbing, healthcare, where you walk, and lift quite a lot); and heavy work (forestry work, farming, fishing, construction work, where you lift a lot of heavy objects and experience a lot of physical strain). The occurrence of physically demanding work was also surveyed (no never, no rarely, yes sometimes, and yes often). To estimate leisure time physical activity during the previous year, 6 different alternatives could be reported: next to nothing; mostly sitting – sometimes a walk; light physical activity (at least 2 h a week), walking, biking, fishing, and dancing; moderate physical activity (1–2 h a week) – jogging, tennis, swimming, gymnastics; high physical activity (at least 3 h a week) – jogging, tennis, swimming, gymnastics; practising sports at a competitive level several times a week – running, skiing, soccer, swimming. Education level provided 3 choices: primary, secondary, and university. Body mass index (BMI) was dichotomized into BMI over and under 25.
According to the MONICA study protocol, the population in this study was selected by stratified randomization for age and sex. The sample in the MONICA study included 8356 subjects, 6000 of whom (72%) answered the MONICA questionnaire. Of these, 5798 (97%) answered the questions on LBP. The non-participants from the MONICA study were contacted through telephone interviews or letters. Among them, fewer had been informed of high blood pressure; they were more often cigarette smokers; and they had a somewhat lower BMI (self-reported) than the participants. Furthermore, a smaller proportion of non-participants than participants were married or cohabitating. There were, however, no substantial differences in level of education between the respondents and non-respondents (7).
Statistics
Prevalence rates in different age groups, frequencies of factors associated with LBP, duration and frequencies in time of LBP and prevalence of chronic LBP were described as relative frequencies. The prevalence of LBP is presented as the total prevalence for the whole sample. Also, tested by logistic regression was the association between levels of physical activity at work during the last year, occurrence of physically demanding work and physical activity during leisure time in the last year as explanatory variable and LBP as outcome. In the descriptive statistic analyses, 2 levels of physical activity at work during the last year were created, high and low physical activity, out of the 4 possible categories. “Moderate heavy work” and “heavy work” were merged into high physical activity and “sedentary work” and “light physically work” were merged into low physical activity. In the logistic regression, all 4 categories of physical activity at work were used.
The question about physical activity during leisure time in the last year was divided into 2 categorical levels, low and high leisure time physical activity. Low physical activity was ranged from no physical activity at all to light physical training with a minimum of 2 h a week. High physical activity was ranged from moderate physical activity 1–2 h
a week to practising sports at a competitive level several times a week. The reason for this dichotomization was based on routines and recommendations for physical activity at the time the questionnaire was distributed (1999), used in the Västerbotten Intervention Programme of Cardiovascular Disease. In order to achieve health benefits, the least amount of physical activity recommended was 3 times per week,
30 min each time, in total 1.5 h per week, at a moderate level. High leisure time physical activity was also connected with activities that require changing into sports clothing. The 2 categories were used both in the descriptive statistic analyses and the logistic regression.
The question about whether the work was physically demanding or not was dichotomized. Work was defined to be demanding when reporting “yes, sometimes” or “yes, often” and not demanding when reporting “no, rarely” or “no, never”. In the first step we tested factors associated with LBP and possible covariates, one at a time, in a univariate logistic regression model. As a next step, we tested physical activity at work and in leisure time in the last year and occurrence of physically demanding work in a multiple model including all statistically significant variables from the univariate testing in order to control for possible covariates. The results are presented as odds ratios (OR) and corresponding 95% confidence intervals (CI). The statistical package SPSS, version 13.0 was used for all calculations.
RESULTS
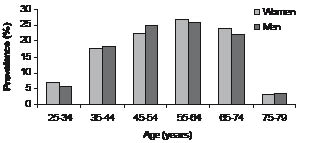
The number of respondents answering the questions about LBP was 5798. Forty-one percent reported having LBP (n = 2377) and, of this number, 54.6% were women and 45.4% were men. The prevalence among women was 44.1% and among men 37.8%. The mean age was 54.6 (standard deviation (SD) 12.6) years, for both men and women. Among those with LBP the prevalence was highest in the age group 55–64 years, for both men and women (Fig. 1).
Fig. 1. Prevalence of low back pain in different age groups (n = 2377).
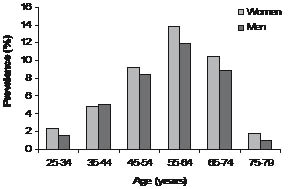
Of the respondents with LBP, 4.5% were affected by LBP during the last week, 7.2% during the last 6 months and 81.1% for more than 6 months. Relative frequencies of duration of LBP during the last week, the last 6 months and more than 6 months for women were 4.6%, 7.0%, and 88.4%, respectively, and for men 5.7%, 8.6% and 85.7%, respectively, (n = 2243). Relative frequencies of how often individuals suffered from LBP was also noted: continuous pain, pain occasionally every month, or pain occasionally every year, was found for women to be 45.5%, 31.8% and 22.7%, respectively, and for men 38.9%, 30.7% and 30.4%, respectively. Of those with LBP, 42.6% of the women and 36.7% of the men reported to have LBP continuously for more than 6 months. This was defined as chronic LBP and was most common in the age group 55–64 years (Fig. 2).
Fig. 2. Prevalence of chronic low back pain among individuals with low back pain (n = 949).
Physical activity and LBP
Individuals with LBP more frequently had physically demanding work and high physical work activity, but low physical activity during leisure time (Table I). Furthermore, more often they lived in smaller communities, were less educated, were smokers and had higher BMI. There was a difference between women and men concerning factors associated with LBP, but the difference was about the same for individuals with and without LBP (Table II). Factors associated with LBP were still significant after taking into consideration possible covariates (BMI, age, sex, education, regular smoking and community size) tested by multiple logistic regression (Table III).
| Table I. Relative frequencies of persons with and without low back pain (41%/59%) and factors associated with low back pain tested by univariate logistic regression. Results expressed as odds ratios (OR) and 95% confidence intervals (95% CI). Significant OR values are shown in bold |
| Variables associated with low back pain | Low back pain | OR | 95% CI for OR |
| Yes (%) | No (%) |
| Physical activity at work in the last year (n = 3854) |
| Sitting work (n = 915) | 21.2 | 25.3 | Ref. | – |
| Light physical work (n = 1506) | 37.2 | 40.2 | 1.11 | 0.93–1.31 |
| Moderate heavy work (n = 1168) | 34.0 | 28.1 | 1.45 | 1.21–1.73 |
| Heavy work (n = 265) | 7.7 | 6.4 | 1.44 | 1.09–1.90 |
| Occurrence of physically demanding work (n = 3438) |
| No never (n = 979) | 24.9 | 30.7 | Ref | – |
| No rarely (n = 852) | 22.3 | 26.3 | 1.04 | 0.86–1.26 |
| Yes sometimes (n = 1068) | 32.4 | 30.3 | 1.31 | 1.10–1.57 |
| Yes often (n = 539) | 20.4 | 12.7 | 1.97 | 1.59–2.45 |
| Low physical activity during leisure time in the last year (n = 4355) | 78.9 | 73.5 | 1.35 | 1.19–1.53 |
| Female (n = 2948) | 54.6 | 48.2 | 1.29 | 1.17–1.44 |
| Age group (years) |
| 25–34 (n = 454) | 6.3 | 8.9 | Ref. | – |
| 35–44 (n = 1069) | 18.0 | 18.8 | 1.35 | 1.07–1.70 |
| 45–54 (n = 1395) | 23.5 | 24.5 | 1.35 | 1.08–1.70 |
| 55–64 (n = 1400) | 26.3 | 22.7 | 1.63 | 1.31–2.04 |
| 65–74 (n = 1290) | 22.6 | 22.0 | 1.44 | 1.15–1.81 |
| 75–79 (n = 190) | 3.4 | 3.2 | 1.47 | 1.04–2.09 |
| Education |
| University (n = 1153) | 16.4 | 22.3 | Ref. | – |
| Secondary (n = 2666) | 47.3 | 45.1 | 1.42 | 1.23–1.64 |
| Primary (n = 1979) | 36.3 | 32.7 | 1.50 | 1.29–1.75 |
| BMI ≥ 25 (n = 3590) | 65.5 | 59.7 | 1.28 | 1.15–1.43 |
| Regular smoking (n = 924) | 17.6 | 14.8 | 1.23 | 1.07–1.41 |
| Community size | | | | |
| > 15,000 inhabitants (n = 2798) | 45.9 | 49.9 | Ref. | – |
| 1000–15,000 inhabitants (n = 1470) | 25.4 | 25.3 | 1.09 | 0.96–1.24 |
| < 1000 inhabitants (n = 1481) | 28.1 | 23.8 | 1.29 | 1.13–1.46 |
| Table II. Demographic factors and factors associated with low back pain |
| Variable | Low back pain | No low back pain |
| Men (n =1078) | Women (n = 1299) | Men (n = 1772) | Women (n = 1649) |
| Age, years (mean (SD)) | 54.6 (12.5) | 54.6 (12.6) | 54.2 (13.3) | 52.9 (13.1) |
| Education, n (%) |
| University | 129 (12.0) | 262 (20.2) | 320 (18.1) | 442 (26.8) |
| Secondary* | 543 (50.4) | 581 (44.7) | 856 (48.3) | 686 (41.6) |
| Primary† | 406 (37.7) | 456 (35.1) | 596 (33.6) | 521 (31.6) |
| Physical activity, n (%) |
| Low physical activity during leisure time in the last year | 778 (72.6) | 1081 (84.1) | 1231 (69.9) | 1265 (77.2) |
| High physical activity at work in the last year | 304 (44.9) | 309 (38.8) | 454 (37.6) | 366 (31.2) |
| Physically demanding work | 316 (52.3) | 382 (53.1) | 447 (41.2) | 462 (44.8) |
| BMI > 25, n (%) | 755 (70.1) | 797 (61.6) | 1185 (66.9) | 853 (51.9) |
| Regular smoking, n (%) | 140 (13.0) | 278 (21.4) | 231 (13.0) | 275 (16.7) |
| Community size, n (%) |
| < 15,000 inhabitants | 603 (55.9) | 668 (51.4) | 880 (49.6) | 800 (48.5) |
| *Upper secondary school, residential college for adult education, vocational school. †Elementary school, comprehensive school. SD: standard deviation; BMI: body mass index. |
| Table III. Level of physical activity associated with low back pain tested in a multiple logistic regression model*. Results expressed in odds ratios (OR) and confidence interval 95% (CI) (n = 3791). Significant OR values are shown in bold |
| Variables associated with low back pain/ covariates | OR | 95% CI for OR |
| Physical activity at work in the last year |
| Sitting work | Ref. | – |
| Light physical work | 1.13 | 0.95–1.35 |
| Moderate heavy work | 1.37 | 1.14–1.65 |
| Heavy work | 1.46 | 1.09–1.94 |
| Occurrence of physically demanding work |
| No never | Ref | – |
| No rarely | 1.03 | 0.84–1.25 |
| Yes sometimes | 1.22 | 1.01–1.48 |
| Yes often | 1.77 | 1.41–2.22 |
| Low physical activity during leisure time in the
last year | 1.16 | 1.02–1.33 |
| *Adjusted for body mass index, age, sex, education, regular smoking and community size. |
DISCUSSION
This population-based study showed that there is an association between LBP and physical activity. LBP was more common among individuals with physically demanding jobs but low physical activity during leisure time. A dose-response relationship has been shown between both short and long-term LBP and increasing workload (8). Physical workload, such as manual material handling, bending and twisting, as well as whole-body vibration, constitutes an increased risk for LBP (9, 10). This is especially pronounced in women, when exposed to similar heavy loads as men (11). In our study, both sexes reported equal physically demanding work, although men with LBP had higher physical activity during work the last year. It is possible, that women when exposed to the same workload as men, experience their work as more physically demanding, especially when they have LBP. In our study sedentary work, compared with light physical work, was not a factor associated with LBP, which is in accordance with other recent studies (8, 9, 11).
Very little is published about the relationship between physical activity and LBP in the general population. The reason is that the description of physical activity in terms of type, intensity, frequency and duration of physical activity has not been defined in studies (8).
An interesting finding in our study was that people, especially women, with LBP reported to have lower physical activity during leisure time compared with those without LBP. In the multivariate analysis, low physical activity during leisure time seemed to be associated with LBP, though the risk was slightly increased. In the questionnaire, the definition of high physical activity was connected with activities that require changing into sports clothing. People who walk or cycle up to 2 h a week were therefore defined as people with low physical activity. This weakness in our study protocol might explain the high prevalence rates of low physical activity in both groups and the weak association in the multivariate analysis. The dichotomization of physical activity in this study was based on recommendations of being physically active at a lower level than today’s recommendations, for health benefits. More recent recommendations on physical activity state that one should engage in at least 30 min of moderate physical activity, 5 days per week, in order to achieve health benefits (12).
Previous studies showed inconsistent findings and there appeared to be no evidence for an effect of sports activities or other physical activities on LBP (9, 13–16).
Other factors that were associated with LBP were low education, living in a small community, being a regular smoker, and a BMI over 25. The total prevalence of LBP in the present study was 41%, and was higher among women (44%) than men (38%), which is in agreement with other studies (17–21). Our study, as well as previous studies, showed that prevalence rates increase with age (22).
There is no clear definition in the literature on chronic LBP. Sometimes it is defined as LBP that lasts for longer than 7–12 weeks. Others classify it as pain that lasts beyond the expected period of healing, or frequently recurring back pain that affects the individual over a long period. It is generally accepted that the recovery process is slow after 3 months (23, 24). With a cut-off at 6 months with continuous pain, we certainly did include individuals with chronic low back problems.
Women with LBP were more often smokers compared with women without LBP. This difference was not seen among males. Our findings are in accordance with earlier results, that smoking should be considered a weak risk factor and not a cause of LBP (2, 25).
Despite a large number of studies on the link between body weight and LBP, there is no convincing evidence for the causal connection according to a large review article (26). We found a weak positive association between BMI and LBP. There was a high prevalence rate of BMI over 25 in our population, and it was slightly higher among those with LBP. A different definition of overweight with a higher limit of BMI might have influenced the results differently in our, as well as other, studies.
Individuals with LBP reported lower education, and they were more likely to live in sparsely populated areas. Other studies and Swedish statistics showed also that pain and functional disability are more frequent in sparsely populated areas (5) and that severe back pain is less prevalent among adults of higher socioeconomic status (27). There is no simple explanation for our findings, but the high unemployment rate, the predominantly blue-collar work, and few opportunities to change work, for low-educated individuals in these areas probably influenced the results of the survey.
This population-based cross-sectional study afforded an opportunity to investigate a large randomly selected population, which was not selected because of a history of LBP. Many of the cardiovascular risk factors recorded in the MONICA project are considered to be interesting factors in relation to low back problems. Since the main focus of the MONICA questionnaire was not on LBP, one benefit for the purposes of this study was that participants were less likely to be overly-attentive to their own lower back condition and therefore avoid the risk of over-reporting. Despite this, the prevalence rates of chronic back pain were quite high, which could be due to the design of the questionnaire, which contained a combination of questions about duration and frequency of LBP. Reporting continuous LBP for more than 6 months, which was the definition of chronic LBP in our study, could be influenced by recall bias.
There is a need for caution in the assessment of chronic pain because validity and reliability of existing data are uncertain and chronicity should not be defined solely by duration of symptoms (28). We did no further analyses of the differences between men and women, as the differences were negligible between men and women with and without LBP. The differences between participants and non-participants concerning information about high blood pressure, being regular cigarette smokers, BMI and civil status should probably not have affected the results. A prevalence study investigating the presence and strength of selective response bias showed no substantial difference in the prevalence of LBP between respondents and non-respondents (29). Hence, there is no reason to assume that those who did not answer the questions about LBP (3%) should differ from other non-participants (28%) in the MONICA project as a whole.
REFERENCES
1. Katz JN. Lumbar disc disorders and low-back pain: socioeconomic factors and consequences. J Bone Joint Surgery Am 2006; 88: 21–24.
2. SBU-Statens beredning för medicinsk utvärdering [The Swedish council on technology assessment in health care]. Ont i ryggen ont i nacken. 2000: vol 1 (in Swedish).
3. Waddell G, editor. The back pain revolution. Edinburgh: Churchill Livingstone; 1998.
4. Walker BF. The prevalence of low back pain: a systematic review of the literature from 1966 to 1998. J Spinal Disord 2000; 13: 205–217.
5. Vingård E. Rörelseorganens sjukdomar. In: Socialstyrelsen. Folkhälsorapporten 2005 [The National Public Health Report 2005]. Stockholm: Edita Norstedts Tryckeri; 2005, p. 154–165 (in Swedish).
6. Stegmayr B, Lundberg V, Asplund K. The events registration and survey procedures in the Northern Sweden MONICA project. Scand J Public Health 2003; 31: 9–17.
7. Eriksson M, Stegmayr B, Lundberg V. MONICA quality assessment. Scand J Public Health 2003; 31: 25–30.
8. Hartvigsen DC, Bakketeig LV, Leboeuf-Yde C, Engberg M, Lauritzen T. The association between physical workload and low back pain clouded by the “healthy worker” effect: Population-based cross-sectional and 5-year prospective questionnaire study. Spine 2001; 26: 1788–1793.
9. Hoogendoorn WE, Van Poppel MNM, Bongers PM, Koes BW,
Bouter LM. Physical load during work and leisure time as risk factors for back pain. Scand J Work Environ Health 1999; 25: 387–403.
10. Bildt Torbjörnsson C, Alfredsson L, Fredriksson K, Michélsen H, Punnett L, Vingård E, et al. Physical and psychosocial factors related to low back pain during a 24-year period. A nested case-control analysis. Spine 2000; 25: 369–375.
11. Macfarlane GJ, Thomas E, Papageorgiou A, Croft P, Jayson MIV, Silman A. Employment and physical work activities as predictor of future low back pain. Spine 1997; 22: 1143–1149.
12. American College of Sports Medicine/American Heart Association. Guidelines for healthy adults under age 65. 2007. Available from: http://www.acsm.org/AM/Template.cfm?Section = Home_Page&TEMPLATE = /CM/HTMLDisplay.cfm&CONTENTID = 7764. 2008–03–15.
13. Leino PI. Does leisure time physical activity prevent low back disorders? Spine 1993; 18: 863–871.
14. Croft PR, Papageorgiou A, Thomas E, Macfarlane G, Silman AJ. Short-term physical risk factors for new episodes of low back pain. Prospective evidence from the South Manchester back pain study. Spine 1999; 24: 1556–1561.
15. Hildebrandt.H, Bongers PM, Dul J,van Dijk FJH, Kemper HCG. The relationship between leisure time, physical activities and musculoskeletal symptoms and disability in worker populations. Int Arch Occup Environ Health 2000; 73: 507–518.
16. Jacob T, Baras M, Zeev A, Epstein L. Physical activities and low back pain: A community-based study. Med Sci Sports Exerc 2004; 36: 9–15.
17. Papageorgiou AC, Croft PR, Ferry S, Jayson MIV, Silman AJ. Estimating the prevalence of low back pain in the general population. Evidence from the South Manchester back pain survey. Spine 1995; 20: 1889–1894.
18. Picavet HSJ, Schouten JSAG, Smit HA. Prevalence and consequences of low back pain in the Netherlands, working vs non-working population, the MORGEN-study. Public Health 1999; 113: 73–77.
19. Santos-Eggimann B, Wietlisbach V, Rickenbach M, Paccaud F, Gutzwiller F. One-year prevalence of low back pain in two Swiss regions. Estimates from the population participating in the 1992–1993 MONICA project. Spine 2000; 20: 2473–2479.
20. Waxman R, Tennant A, Helliwell P. A prospective follow-up study of low back pain in the community. Spine 2000; 25: 2085–2090.
21. Harkness EF, Macfarlane GJ, Silman AJ, McBeth J. Is musculoskeletal pain more common now than 40 years ago? Two population-based cross-sectional studies. Rheumatology, Advance Access 2005: March 22; 1–6.
22. Leclerc A, Chastang JF, Ozguler A, Ravaud JF. Chronic back problems among persons 30 to 64 years old in France. Spine 2006; 31: 479–484.
23. Hestbaek L, Leboeuf-Yde C, Manniche C. Low back pain: what is the long-term course? A review of studies of general patient populations. Eur Spine J 2003; 12: 149–165.
24. Cassidy JD, Coté P, Carroll LJ, Kristman V. Incidence and course of low back pain episodes in the general population. Spine 2005; 30: 2817–2823.
25. Leboeuf-Yde C. Smoking and low back pain. A systematic review of 41 journal articles reporting 47 epidemiologic studies. Spine 1999; 24: 1463–1470.
26. Leboeuf-Yde C. Body weight and low back pain. A systematic review of 56 journal articles reporting on 65 epidemiologic studies. Spine 2000; 25: 226–237.
27. Latza U, Kohlmann T, Deck R, Raspe H. Influence of occupational factors on the relation between socio-economic status and self-reported back pain in a population-based sample of German adults with back pain. Spine 2000; 25: 1390–1397.
28. Hestbaek L, Leboeuf-Yde C, Engberg M, Lauritzen T, Bruun NH, Manniche C. The course of low back pain in a general population. Results from a 5-year prospective study. J Manipulative Physiol Ther 2003; 26: 213–219.
29. Cassidy D, Carroll L, Côté P. The Saskatchewan Health and Back Pain Survey: the prevalence of low back pain and related disability in Saskatchewan adults. Spine 1998; 23: 1860–1867.