OBJECTIVES: To explore the correlation between clinical assessment and force plate measurement of postural control after stroke when selected balance tasks are performed under similar spatial and temporal conditions, and to examine the inter-rater agreement of assessment of weight distribution during quiet stance in subjects with stroke.
DESIGN: A descriptive and correlational study.
METHODS: Clinical assessment of postural control using Berg Balance Scale, video recording for rating of weight distribution, and force plate measurement with the Vifor-system, were performed in 20 subjects with stroke.
RESULTS: Mean velocity of displacement of the centre of pressure in the anterior-posterior direction correlated moderately with scores from the Berg Balance Scale items “maintaining a position” in the whole sample (rs = –0.50, p <0.05) as well as in a subgroup of subjects with stroke with submaximal Berg Balance Scale scores (rs = –0.62, p < 0.05). Moderate correlation was found between ratings of each of 3 physiotherapists and centre of pressure’s mean position in the frontal plane on the force plate, while the inter-rater agreement was poor.
CONCLUSION: Clinical assessment of postural control and weight distribution showed moderate correlation with force plate measurement when the assessments were performed under similar conditions. The data suggest that the reliability of observational postural analysis needs to be improved.
Key words: postural control, stroke, Berg Balance Scale, force plate measures, weight distribution.
J Rehabil Med 2007; 39: 448–453
Correspondence address: Gunilla Elmgren Frykberg, Department of Neuroscience, Rehabilitation Medicine, Uppsala University, University Hospital, SE-751 85 Uppsala, Sweden. E-mail: gunilla.elmgren.frykberg@rehab.uu.se
Submitted February 21, 2006; accepted February 5, 2007
INTRODUCTION
Postural control disorders are common in patients after post-acute stroke (1) and this is an area of critical importance in stroke rehabilitation research (2). Impaired postural control is one of the major factors influencing functional performance after stroke (3) and has a great impact on self-perceived disability 6 months after discharge from rehabilitation (4). Furthermore, patients after stroke are at high risk of falling, and the development of fall prevention strategies should be a priority (5). There is a lack of evidence, however, to support any specific physiotherapy approach to improve postural control after stroke (6).
There is no universal definition of postural control and the neural mechanisms are not fully understood (7, 8). According to a systems approach to postural control (7, 9) many subsystems contribute to maintain and regain postural orientation and stability, i.e. balance, of the body in space during daily activities. Any of the subsystems involved in postural control or the co-ordination between these systems may be affected by a brain lesion (7, 9). Furthermore, medication, age, memory deficits and/or inattention (10), as well as lack of self-efficacy (11), can influence the maintenance and regaining of posture and balance.
Clinical assessment of postural control disorders is often performed through visual observation using standardized instruments (12, 13). Individual pre-requisites, characteristics of the task, and the environment in which the task is performed, are important factors to be considered while assessing postural control (7, 13, 14). Consequently, clinical assessment is a difficult task due to the complex and flexible nature of balance control (14), and even assessing quiet standing is demanding. It has been suggested that symmetry of stance, as a postural control task, is an important factor in assessing dysfunction in stroke patients (15, 16). However, the reliability of clinical assessment of symmetry of stance, i.e. weight distribution, in standing is questioned (17, 18).
Several studies describing postural control after stroke have been performed in the laboratory. Different aspects of postural control have been investigated, making comparison difficult (19). Studies in which force plates were used (e.g. 1, 17) reveal that patients after stroke, compared with control subjects, exhibit increased sway-activity and lateral displacement in the direction of the non-affected leg during quiet stance. Patients after stroke present more varied and slower motor responses during external perturbations (20) and delays and compensations in anticipatory postural activities during voluntary movements (8, 21).
From a theoretical viewpoint (8, 19) studies investigating the correlation between clinical assessment and laboratory measurement are crucial to expand the knowledge of human motor control, including postural control. Despite this, there are only a few studies considering this correlation in patients after stroke (21–23). Furthermore, although discussed in the literature (7, 13, 14) the importance of the spatial and temporal conditions under which the balance tasks are performed has, to our knowledge, not been considered in previous studies.
Thus, the aim of this study was to explore the correlation between clinical assessment and laboratory measurement of postural control after stroke when selected balance tasks are performed under similar spatial and temporal conditions. A subordinate aim was to examine the inter-rater agreement of assessing weight distribution during quiet stance in subjects with stroke.
METHODS
Subjects
Two experienced physiotherapists selected the subjects from an outpatient register, according to the following criteria: prior stroke, age 20–65 years, leg/foot paresis, ability to stand without support for at least 2 minutes and ability to follow verbal instructions adequately. Exclusion criteria were visual problems, orthopaedic disorders or neurological impairments other than stroke that could influence the postural control.
Twenty subjects, 8 women and 12 men with a mean age of 50.1 years (standard deviation (SD) 9.8), agreed to participate in the study. All had suffered a stroke more than 6 months previously (mean 2.3 years; range 0.5–11). Eleven subjects had a right-sided and 9 subjects a left-sided hemiparesis. All subjects were ambulant outdoors; 2 walked with a walking frame and one with a cane. The study was approved by the local ethics committee of the medical faculty.
Data collection
The Berg Balance Scale (BBS) was used clinically to observe and assess balance. The scale comprises 14 items, testing the ability to maintain positions of different difficulty by decreasing the base of support, assessing different transfers and the ability to maintain balance while voluntary movements are performed. Each item is scored 0–4, with a total score of 56 (24). The assessment takes 20–30 minutes, depending upon the sensorimotor and cognitive function of the subject. The scale has been shown to possess very good inter-rater (0.98) and intra-rater (0.97) intraclass correlation coefficients. The internal consistency of the scale is also very good (24, 25). Prognostic and concurrent validities have demonstrated moderate statistical correlations (21, 23). The BBS was designed to assess balance function in an elderly population. It has also been used in studies of balance in patients with different diagnoses, including stroke (21, 23).
According to task-specific demands, 2 subgroups of tasks in BBS were constructed. The subgroup “maintaining a position” included the following balance tasks: standing and sitting unsupported, standing with eyes closed and with feet together respectively, tandem stance and standing on 1 foot (maximum score 24). The other subgroup was referred to as “dynamic balance” and included the remaining 8 items involving transfers of different kind and voluntary movements (maximum score 32). This subdivision of BBS items was done to make comparisons between data from force plate measurement during quiet stance and the static component of BBS (“maintaining a position”) possible, i.e. comparing similar balance tasks.
To enable rating of the stroke subjects’ weight distribution in quiet stance, a scale with 5 categories was constructed for the purpose: 1 = weight bearing significantly more on left than on right leg; 2 = weight bearing somewhat more on left than on right leg; 3 = equal weight bearing on left and right leg; 4 = weight bearing somewhat more on right than on left leg and 5 = weight bearing significantly more on right than on left leg.
The Vifor- (video force) system was used to collect force data. This system consists of a computerised piezoelectric force plate (Kistler type 9284, Kistler Instrumente AG, Winterthur, Switzerland) and 2 video cameras, which were situated at a distance of 4 metres (sagittal plane) and 8.5 metres (frontal plane) from the force plate (26). Force plate measures were collected during 30 seconds, with a sampling frequency of 50 Hz. Six force plate measures were calculated: standard deviation of the displacement (mm) of centre of pressure (CoP) in the anterior-posterior, σ (CoPx), and medial-lateral direction, σ (CoPy), mean velocity of the displacement of CoP (mm/s) in the anterior-posterior, CoPx vel, and medial-lateral direction, CoPy vel, and standard deviation of the ground reaction forces (F) (mm/s2), normalized with respect to body mass (kg), in the anterior-posterior σ (Fx/kg) and medial-lateral σ (Fy/kg) direction. The 2 last-mentioned measures could also be interpreted as the SD of the acceleration of the centre of mass (CoM) of the body in different directions.
The first 4 measures are often reported and were chosen in this study specifically to enable comparisons with earlier published studies (21–23). The last 2 measures were selected due to the reported value of information of ground reaction forces (GRF) in studies concerning postural control (27, 28).
The force plate data were low-pass filtered with a cut-off frequency of 10 Hz to reduce measurement noise. To remove slow drifts in the CoP, which are not directly associated with postural activity, the CoP data were high-pass filtered with a cut-off frequency of 0.1 Hz. To test the reliability within the force plate data 3 × 30-second measurements were performed. It was shown that the variations within the individuals were smaller than between individuals.
The force plate was also used for assessment of weight distribution during quiet stance. Here, data from the force plate were used to calculate the mean value of the position of the CoP in the frontal plane during 30 seconds of quiet stance. This position, initially given in a co-ordinate system defined by the force plate, was translated to a new co-ordinate system centred around the midpoint between the lateral outlines of the actual feet position for each subject.
These lateral outlines were measured with a ruler on the frontal video picture. This translation of the co-ordinate system was necessary, since the subjects were not forced to place the feet in a standardized position on the force plate. Although the force plate is a very precise instrument, the accuracy is decreased, partly due to the use of limited video resolution. As described previously (26), the accuracy in the position of the CoP is about 5 mm when using a high-quality television monitor and a standard resolution video-recording.
Procedure
All data collection was performed in a laboratory environment. The subjects were lightly dressed and wore ordinary shoes for indoor activities. One person chose to be barefoot.
Videotape recordings were made with the subject standing on the force plate, immediately before the other data collection. The recordings included a frontal view and a view from behind during 15 seconds, respectively, to allow rating of weight distribution in standing at a later occasion. It was not possible to video-record at exactly the same time as the force measurement because the vector of the reaction force is simultaneously visualized on the video picture. During all measurements the subjects stood with their feet in a self-chosen position.
The tasks in the BBS were assessed by a physiotherapist who was unaware of the project objectives. Whenever possible, force plate measures were simultaneously collected during the balance items. The remaining balance tasks in BBS were performed and assessed directly after the measurement of force.
A separate rating of each subject’s weight distribution in quiet stance, using the scale with 5 categories described earlier, was subsequently carried out by 3 other experienced physiotherapists who viewed the videotapes independently. These physiotherapists were blinded to all other data collected.
Data analysis
Descriptive statistics were used to characterize the subjects concerning scores on BBS and force plate measures. Matlab was used for signal processing and SPSS (Version 11.5) for statistical analyses.
The results of the BBS assessment (total score and scores from the 2 subgroups) were compared with each of the force plate measures from the balance item standing unsupported. This data processing was chosen to enable comparison with the study accomplished by Berg et al. (23). Spearman rank correlation coefficient method was used to estimate the strength of the correlations. The analysis of force plate data from the other 13 balance items is beyond the scope of the present article.
Weighted kappa statistics (29) were used to assess the agreement between the 3 physiotherapists’ rating of the stroke subjects’ weight distribution in quiet stance. For the weighted kappa, weight 1 was used for complete agreement and weight 0.5 for a disagreement of 1 “step” concerning the categories in the assessing formula. All other disagreements were given weight 0. Mean values concerning weight distribution for each subject were calculated from the 3 observers’ ratings in 5 categories.
Spearman’s rank correlation coefficient between each observer’s rating of the subjects’ weight distribution and the force plate measures of mean position of CoP, in the frontal plane during 30 seconds of quiet stance, was calculated. The level of significance was set at p < 0.05, if not otherwise specified.
RESULTS
All subjects performed the 14 balance tasks in 20–35 minutes. Seven of the subjects had a total score of 56 points on BBS, i.e. maximum score. The mean score was 51.4, ranging from 30 to 56. For the 13 subjects who did not get maximum score on BBS, the mean score was 47.8, ranging from 30 to 54. The analyses of force plate measures are based on recordings from 19 stroke subjects. Data from one subject were excluded from the analyses using force plate measures, due to continuous and uncontrolled movements of the paretic arm. The mean and SD of force plate measures for 19 stroke subjects in quiet stance are shown in Table I.
| Table I. Mean and standard deviation of force plate measures for the stroke subjects in quiet stance, eyes open (n = 19). |
| Force plate measure | Mean (SD) |
| σ* (CoPx) (mm) | 3.4 (1.0) |
| σ* (CoPy) (mm) | 2.4 (1.4) |
| CoPx vel (mm/s) | 12.4 (6.2) |
| CoPy vel (mm/s) | 7.9 (3.0) |
| σ* (Fx/kg) (mm/s) | 15.5 (6.0) |
| σ* (Fy/kg) (mm/s) | 10.9 (4.3) |
| *σ indicates standard deviation within a subject during 30 seconds. CoP: centre of pressure; x: anterior-posterior; y: medial-lateral; vel: velocity; F: ground reaction force; kg: normalized to body mass. |
Correlations between clinical assessment of balance and force plate measurement
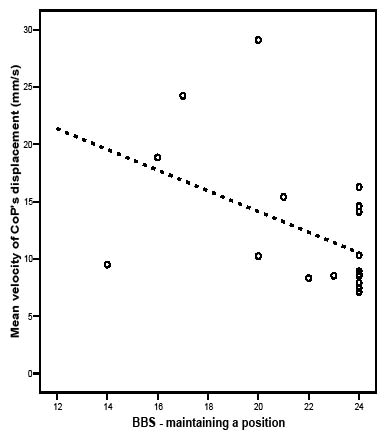
No significant correlation was shown between total score on BBS and force plate measures during quiet stance in the total study group. There was a significant correlation between BBS score for the subgroup “maintaining a position” and the mean velocity of CoP’s displacement in anterior-posterior direction, rs = –0.50. The scatter plot in Fig. 1 shows that, in subjects who scored maximum on BBS “maintaining a position”, the mean velocity of CoP’s displacement in anterior-posterior direction varied within a considerable part of the total range observed in the study sample.
Fig. 1. Scores on the Berg Balance Scale (BBS) subgroup “maintaining a position” in 19 stroke subjects plotted against the mean velocity of centre of pressure is (CoP) displacement in the anterior-posterior direction. Regression line shown as illustration (rs = –0.50).
When data from the 7 stroke subjects with maximum score on BBS were excluded, moderate correlations were found between the total score on BBS and the σ (Fx/kg), rs = –0.59 and between the score on the BBS items “maintaining a position” and the σ (Fx/kg), rs = –0.66. In this subgroup of subjects, there was also a correlation between the BBS items “maintaining a position” and the mean velocity of CoP’s displacement in anterior-posterior direction, rs = –0.62 (Table II). This group of subjects did not differ demographically from the whole group.
| Table II. Spearman’s rank correlation between total and subgroups of Berg Balance Scale (BBS) and force plate measures for subjects with less than 56 scores on BBS (n = 12). |
| | Berg Balance Scale |
| Total | ”Maintaining a position” | ”Dynamic balance” |
| σ (CoPx) (mm) | –0.43 | –0.54 | 0.18 |
| σ (CoPy) (mm) | –0.07 | –0.15 | 0.31 |
| CoPx vel (mm/s) | –0.51 | –0.62* | 0.06 |
| CoPy vel (mm/s) | –0.32 | –0.38 | 0.03 |
| σ (Fx/kg) (mm/s) | –0.59* | –0.66* | –0.12 |
| σ (Fy/kg) (mm/s) | –0.15 | –0.25 | 0.08 |
| *Correlation is significant at the 0.05 level. CoP: centre of pressure; x: anterior-posterior; y: medial-lateral; vel: velocity; F: ground reaction force; kg: normalized to body mass. |
Inter-rater agreement of weight distribution
The physiotherapists’ ratings of 5 categories of weight distribution in standing of the 20 subjects after stroke are shown in Table III.
| Table III. Three physiotherapists’ (A, B and C) ratings of weight distribution in the subjects after stroke during quiet stance; range; mean of the ratings (n = 20) and mean position of centre of pressure (CoP) in the frontal plane on the force plate during 30 seconds (n = 19); a negative value for the mean position of CoP implies that more weight is on the left leg, whereas a positive value indicates more loading on the right leg. |
| Subject | A | B | C | Range | Mean | CoP’s mean position (cm) |
| 1 | 2 | 4 | 4 | 2–4 | 3.33 | 2.6 |
| 2 | 1 | 1 | 1 | 0 | 1.00 | –4.3 |
| 3 | 1 | 3 | 1 | 1–3 | 1.67 | –2.5 |
| 4 | 4 | 5 | 4 | 4–5 | 4.33 | 1.5 |
| 5 | 3 | 3 | 5 | 3–5 | 3.67 | * |
| 6 | 3 | 5 | 1 | 1–5 | 3.00 | 0.1 |
| 7 | 4 | 3 | 3 | 3–4 | 3.33 | 0.3 |
| 8 | 4 | 4 | 5 | 4–5 | 4.33 | 0.1 |
| 9 | 3 | 3 | 2 | 2–3 | 2.67 | –1.9 |
| 10 | 2 | 2 | 2 | 0 | 2.00 | –1.4 |
| 11 | 5 | 5 | 5 | 0 | 5.00 | 5.0 |
| 12 | 3 | 3 | 2 | 2–3 | 2.67 | –1.0 |
| 13 | 3 | 3 | 2 | 2–3 | 2.67 | –0.7 |
| 14 | 3 | 3 | 2 | 2–3 | 2.67 | –1.0 |
| 15 | 4 | 3 | 2 | 2–4 | 3.00 | 0.6 |
| 16 | 4 | 4 | 3 | 3–4 | 3.67 | 0.8 |
| 17 | 3 | 2 | 4 | 2–4 | 3.00 | 0.0 |
| 18 | 5 | 3 | 2 | 2–5 | 3.33 | 3.2 |
| 19 | 3 | 3 | 2 | 2–3 | 2.67 | 2.6 |
| 20 | 3 | 3 | 2 | 2–3 | 2.67 | 1.7 |
| *missing value due to uncontrolled arm-movements. |
The difference in range between maximum and minimum rating of weight distribution was ≤ 1 in 13 of the 20 subjects. The weighted kappa coefficients of the inter-rater agreement were 0.40 between rater A and B, 0.21 between A and C, and 0.28 between B and C. The weighted kappa coefficients hence indicate a poor agreement (29).
Correlation between clinical ratings and force plate measures of weight distribution
Mean values of ratings performed by the 3 physiotherapists, concerning weight distribution in quiet stance, for each subject, as well as mean values of the position of CoP in the frontal plane during 30 seconds of force plate measuring are shown in Table III. A negative sign for the mean position of the CoP implies that more weight is on the left leg, whereas a positive sign indicates more loading on the right leg.
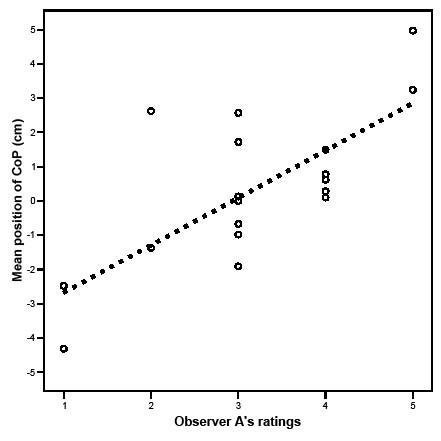
Observer A’s correlation was 0.63 (p < 0.01) (illustrated in Fig. 2), observer B’s was 0.57 and observer C’s was 0.52 when the correlations between ratings of the subjects within each observer and the force plate data of the mean position of the CoP in the frontal plane were calculated. These correlations are interpreted as moderate (30).
Fig. 2. Observer A’s ratings of weight distribution in 19 stroke subjects plotted against the mean position of centre of pressure (CoP) (cm) in the frontal plane during 30 seconds of quiet stance. Regression line shown as illustration (rs = 0.63). Note that 2 of the subjects (numbers 12 and 14) have exactly the same values on both axes.
The correlation between mean rating of all 3 physiotherapists and the mean position of the CoP was rs = 0.72 (p < 0.01).
DISCUSSION
The main finding of this study was that moderate correlations were demonstrated when clinical assessment and force plate measurement of postural control after stroke were performed almost simultaneously. It has been emphasized recently that characteristics of the task and influence of the environment are important factors to consider when assessing postural control (7, 14). Despite the efforts in this study to perform clinical assessment and laboratory measurement almost simultaneously, the correlations were only moderate.
The limited sample size and the asymmetric distribution of balance disorders in the stroke subjects in the present study have to be considered. Optimally, the subjects would have represented a continuum of balance capacities from very poor to very good. An interesting finding was, however, that in the subgroup of subjects who did not have a maximum score on BBS (range 30–54) the most prominent force plate measure correlating to both BBS total score (rs = –0.59) and to BBS “maintaining a position” (rs = –0.66) was the SD of the GRF in the anterior-posterior, i.e. horizontal, direction. This was unexpected in such a small sample, although reasonable. From a mechanical point of view, the position and motion of CoP can be interpreted as indicators of activities in the postural control system, while the horizontal GRF, on the other hand, directly reflects acceleration of the body’s CoM. A displacement of CoP will affect the acceleration of the body’s CoM and thus the horizontal GRF. This finding is also in agreement with some previous studies indicating the potential value of GRF information. One study reported that the test-retest reliability and sensitivity to changes in quiet stance are better for GRF measures compared with CoP measures (27) and another study showed that the SD of the vertical GRF correlated with BBS scores (28).
In the whole study sample, as well as in the subgroup with less than 56 BBS scores, the force plate measure mean velocity of CoP’s displacement in anterior-posterior direction showed moderate correlation with BBS “maintaining a position”, rs = –0.50 and rs = –0.62, respectively. This is in accordance with previous studies (21, 23). The mean velocity of CoP’s displacement has been identified as the most consistent and stable intra-subject force plate measure of all (31). Interestingly, as illustrated in Fig. 1, the mean velocity of CoP’s displacement can be quite low even with a considerable postural control disorder according to clinical assessment, which raises questions about which force plate measures are most valid in studies of postural control.
The lack of a universal definition of postural control indicates the complexity of the concept. The terminology within the area is often non-specific. The word “sway”, for instance, is often referred to as the CoP signal (23), which, according to some authors, is incorrect (32). The interplay between CoP and the vertical projection of CoM, centre of gravity (CoG), is suggested to be an error signal that the postural control system is sensing (32) and could be part of the definition of both sway and postural control. Further research is needed to clarify the importance of this interplay.
One methodological limitation of this study was the use of only one force plate, where only the net CoP was available. In many previous studies, as in the current one, one force plate has been the only option available. The use of 2 force plates has been suggested in order to separate the contributions of the individual limbs (31).
As pointed out, the video recordings were made shortly before the force measurement, which might have influenced the correlation between ratings of weight distribution made by the physiotherapists and the force plate measures of mean position of CoP during 30 seconds of quiet stance. However, it has been demonstrated that there are no statistically significant differences in the distribution on repeated tests in healthy subjects on the same day (18).
In the current study, data from quiet stance were analysed to enable a comparison with the study performed by Berg et al. (23). This item does not seem to challenge balance. It has been shown that not even standing unsupported with head turns discriminates between different functional levels in patients after stroke (33). Therefore, more advanced balance tasks would probably be more appropriate to explore the underlying mechanisms of postural control.
The inter-rater agreement of assessing weight distribution in the subjects after stroke according to a 5-category scale was poor. One contributing factor may be that the body is continuously swaying to some extent during quiet stance. This dynamic activity occurs randomly at varying amplitude (18). Thus, visual assessment of weight distribution during quiet stance might be difficult, as has also been demonstrated for visual assessment of gait (34) and for the quality of movement during functional tasks in patients after stroke (35).
Further research into the underlying neural mechanisms of postural control is necessary in order to guide assessment more specifically and further improve interventions post-stroke, as highlighted recently in a review by Geurts et al. (2). The results of the present study suggest that different characteristics of CoP, and the components of GRF acting during both static and dynamic balance tasks should be investigated further. Balance tasks that distinctly challenge postural control should be investigated preferentially.
In conclusion, this study demonstrates some moderate correlations when clinical assessment of postural control, including weight distribution, and force plate measurement in subjects after stroke were performed under similar spatial and temporal conditions. The study also indicates that the reliability of observational postural analysis needs to be improved.
ACKNOWLEDGEMENTS
We thank Annica Önell for assistance with data processing and Johan Bring for help with statistical analysis. We also thank the physiotherapists who assessed postural control and the subjects who participated in the study.
REFERENCES
1. de Haart M, Geurts AC, Huidekoper SC, Fasotti L, van Limbeek J. Recovery of standing balance in postacute stroke patients: a rehabilitation cohort study. Arch Phys Med Rehabil 2004; 85: 886–895.
2. Geurts ACH, de Haart M, van Nes IJW, Duysens J. A review of standing balance recovery from stroke. Gait Posture 2005; 22: 267–281.
3. Fong KN, Chan CC, Au DK. Relationship of motor and cognitive abilities to functional performance in stroke rehabilitation. Brain Inj 2001; 15: 443–453.
4. Desrosiers J, Noreau L, Rochette A, Bravo G, Boutin C. Predictors of handicap situations following post-stroke rehabilitation. Disabil Rehabil 2002; 24: 774–785.
5. Nyberg L, Gustafson Y. Patient falls in stroke rehabilitation – a challenge to rehabilitation strategies. Stroke 1995; 26: 838–842.
6. Pollock A, Baer G, Pomeroy V, Langhorne P. Physiotherapy treatment approaches for the recovery of postural control and lower limb function following stroke. Cochrane Database of Systematic Reviews 2003, Issue 2. Art. No. CD001920.
7. Shumway-Cook A, Woollacott M. Normal postural control. In: Shumway-Cook A, Woollacott M, editors. Motor control: translating research into clinical practice. 3rd edn. Philadelphia: Lippincott Williams & Wilkins; 2007, p. 157–186.
8. Garland SJ, Willems DA, Ivanova TD, Miller KJ. Recovery of standing balance and functional mobility after stroke. Arch Phys Med Rehabil 2003; 84: 1753–1759.
9. Horak FB. Assumptions underlying motor control for neurologic rehabilitation. In: Lister MJ, editor. Contemporary management of motor control problems. Foundation for Physical Therapy. Proceedings of the II Step Conference. Alexandria: VA: APTA; 1991, p. 11–27.
10. Hyndman D, Ashburn A. People with stroke living in the community: attention deficits, balance, ADL ability and falls. Disabil Rehabil 2003; 25: 817–822.
11. Hellström K, Nilsson L, Fugl-Meyer AR. Relationship of confidence in task performance with balance and motor function. Physiother Theory Pract 2001; 17: 55–65.
12. Shumway-Cook A, Woollacott M. Clinical management of the patient with a postural control disorder. In: Shumway-Cook A, Woollacott M, editors. Motor control: translating research into clinical practice. 3rd edn. Philadelphia: Lippincott Williams & Wilkins; 2007, p. 257–295.
13. Horak FB. Clinical assessment of balance disorders. Gait Posture 1997; 6: 76–84.
14. Huxham FE, Goldie PA, Patla AE. Theoretical considerations in balance assessment. Aust J Physiother 2001; 47: 89–100.
15. Sackley CM. Falls, sway, and symmetry of weight bearing after stroke. Int Disabil Studies 1991; 13: 1–4.
16. Turnbull GI, Charteris J, Wall JC. Deficiencies in standing weight shifts by ambulant hemiplegic subjects. Arch Phys Med Rehabil 1996; 77: 356–362.
17. Shumway-Cook A, Anson D, Haller S. Postural sway biofeedback: its effect on reestablishing stance stability in hemiplegic patients. Arch Phys Med Rehabil 1988; 69: 395–400.
18. Murray PM, Peterson RM. Weight distribution and weight-shifting activity during normal standing posture. Phys Ther 1973; 53: 741–748.
19. Latash ML, editor. Control of human movement. Champaign, IL: Human Kinetics Publishers; 1993, p. 106–108.
20. Holt RR, Simpson D, Jenner JR, Kirker SGB, Wing AM. Ground reaction force after a sideways push as a measure of balance in recovery from stroke. Clin Rehabil 2000; 14: 88–95.
21. Stevenson TJ, Garland SJ. Standing balance during internally produced perturbations in subjects with hemiplegia: validation of the Balance Scale. Arch Phys Med Rehabil 1996; 77: 656–662.
22. Dettmann MA, Linder MT, Sepic SB. Relationships among walking performance, postural stability, and functional assessments of the hemiplegic patient. Am J Phys Med 1987; 66: 77–90.
23. Berg KO, Maki BE, Williams JI, Holliday PJ, Wood-Dauphinee SL. Clinical and laboratory measures of postural balance in an elderly population. Arch Phys Med Rehabil 1992; 73: 1073–1080.
24. Berg K, Wood-Dauphineé S, Williams JI, Gayton D. Measuring balance in the elderly: preliminary development of an instrument. Physiother Can 1989; 41: 304–311.
25. Berg K, Wood-Dauphinée S, Williams JI. The Balance Scale: Reliability assessment with elderly residents and patients with an acute stroke. Scand J Rehabil Med 1995; 27: 27–36.
26. Lanshammar H. VIFOR – a system for force line visualization. In: de Groot G, Hollander P, Huijing P, van Ingen Schenau G, editors. Biomechanics XI-B, International Series on Biomechanics, Volume 7-B. Amsterdam: Free University Press; 1988, p. 984–988.
27. Goldie PA, Bach TM, Evans OM. Force platform measures for evaluating postural control: reliability and validity. Arch Phys Med Rehabil 1989; 70: 510–517.
28. Karlsson A, Frykberg G. Correlations between force plate measures for assessment of balance. Clin Biomech 2000; 15: 365–369.
29. Armitage P, Berry G, editors. Statistical methods in medical research. 3rd edn. Oxford: Blackwell Scientific Publications; 1994, p. 445–447.
30. Colton T, editor. Statistics in Medicine. Boston, MA: Little, Brown and Co; 1974, p. 211.
31. Geurts ACH, Nienhuis B, Mulder TW. Intrasubject variability of selected force platform parameters in the quantification of postural control. Arch Phys Med Rehabil 1993; 74: 1144–1150.
32. Winter DA, Patla AE, Ishac M, Gage WH. Motor mechanisms of balance during quiet standing. J Electromyogr Kinesiol 2003; 13: 49–56.
33. Kairy D, Paquet N, Fung J. A postural adaptation test for stroke patients. Disabil Rehabil 2003; 25: 127–135.
34. Malouin F. Observational Gait Analysis. In: Craik RL, Oatis CA, editors. Gait analysis – theory and application. St Louis: Mosby-Year Book, Inc; 1995, p. 112–124.
35. Pomeroy VM, Pramanik A, Sykes L, Richards J, Hill E. Agreement between physiotherapists on quality of movement rated via videotape. Clin Rehabil 2003; 17: 264–272.