


Mariko Egawa, Tetsuji Hirao and Motoji Takahashi
Life Science Research Center, Shiseido Co. Ltd, Yokohama, Japan
Stratum corneum thickness was estimated from water concentration profiles of the skin measured by a confocal Raman spectrometer. Stratum corneum apparent thickness (SCAT) was defined as the depth where the water content reached an almost constant value. Site variations were determined using 15 healthy Japanese subjects (6 males, 9 females), and age variations at the cheek and forearm were examined using 27 female Japanese subjects. There were marked site variations in mean SCAT; 16.8 μm for cheek, 22.6 μm for volar forearm, 29.3 μm for back of the hand, and 173.0 μm for palm. These variations were similar to reported stratum corneum thickness values obtained in biopsy tissues. The SCAT tended to become age-dependently thicker at the forearm, but not at the cheek. In addition, SCAT was increased up to two-fold by hydration for 90 min, while lesser increases were seen with shorter hydration periods. Key words: in vivo; Raman; stratum corneum; thickness; water concentration profile.
(Accepted August 15, 2006.)
Acta Derm Venereol 2007; 87: 4–8.
Mariko Egawa, Life Science Research Center, Shiseido Co., Ltd, 2-2-1 Hayabuchi, Tsuzuki-ku, Yokohama, 224-8558 Japan. E-mail: mariko.egawa@to.shiseido.co.jp
The skin comprises two main layers: dermis and epidermis, the latter consisting of basal layer, stratum spinosum, stratum granulosum, and stratum corneum (SC). Regarding SC thickness, chronological and photo-ageing changes (1, 2), the relationships between epidermal thickness, pigmentation and human photosensitivity (3), and regional differences (4, 5) have been reported. Measurement of SC thickness is usually based on light microscopy. However, the conventional formalin-paraffin process used in the light microscopy method changes the SC thickness. Recently, a freezing technique (6, 7), was introduced to minimize changes in SC thickness.
There have been several attempts to develop non-invasive techniques to measure SC thickness using high-frequency ultrasonography (8), high-frequency magnetic resonance imaging (9), and pulsed terahertz radiation (10). However, these techniques do not have sufficient resolution to measure SC other than at the heel or palm, and they cannot provide the same resolution and precision as the standard light microscopy method.
Using in vitro methods, it has been reported that the water content gradually increases, going from the upper part of SC down to the viable epidermis, reaching an almost constant value thereafter (11, 12). Warner et al. (11) using in vitro X-ray microanalysis, reported a continuous increase in the water content of SC (g water/g tissue), from about 15% to 25% at the skin surface to a constant level of about 70% in the viable stratum granulosum, which corroborates the theoretical prediction of water concentration profile across the skin (13). The same authors also showed that a large discontinuity in water content occurred at the boundary between the SC and stratum granulosum, which makes it possible to estimate SC thickness in vivo by detection of this interface.
Regarding non-invasive methods for monitoring water content in the skin in vivo, instruments based on electrical properties, such as conductance (14) and capacitance (15, 16), and spectroscopic techniques, such as near-infrared spectroscopy (17–20), have been used. However, it is difficult to control measurement depth using these instruments. Recently, a confocal Raman spectrometer was used in vivo to measure molecular concentration-depth profiles in the skin for water and amino acids, with a 2 μm interval (21–23).
The aim of this study was to estimate human SC apparent thickness (SCAT) by measurement of in vivo water concentration profiles using Raman spectroscopy, and in addition to determine site and age variations of SC thickness.
MATERIALS AND METHODS
Instrumentation
Raman spectra were obtained at different depths below the skin surface using a confocal Raman spectrometer (Model 3510, River Diagnostics BV, Rotterdam, The Netherlands), which is designed for in vivo investigation of human skin (21–23). The skin was positioned on an aluminium stage containing a CaF2 window, which served as a reference plate to determine skin surface position and to prevent movement artefacts.
Subjects
A total of 33 healthy Japanese volunteers, 6 men (age range 34–54 years, mean 43.2 years), and 27 women (age range 23–76 years, mean 56.3 years) were enrolled. Among them, site variation experiments were conducted at five sites, i.e. cheek, upper arm (flexor aspect), volar forearm, back of the hand, and palm (ball of the thumb), of 15 subjects, (all the men and 9 women age range 23–49 years, mean 35.4 years). For determination of age variations, Raman spectra obtained at the cheek and volar forearm of all the female subjects were used. None of them had any history of skin disorders and none was taking medication at the time of the experiment.
The procedures followed were in accordance with the ethical standards of the responsible committee on human experimentation in our company (Shiseido Co. Ltd) and with the Helsinki Declaration.
In vivo Raman spectra
Subjects washed the measurement areas once with solid soap 1 h before Raman measurement. In vivo depth profiles of Raman spectra were measured at 2 μm intervals from the skin surface towards the interior, along a line perpendicular to the skin. Raman spectra were recorded with an excitation wavelength of 671 nm and a measurement time of 1 second per spectrum in the 2600–4000 cm–1 region. Spectra were calibrated and corrected for the instrument response (20–22). The laser power on the skin was 17.0–19.0 mW. All measurements were performed at 23.5–24.5ºC and 57–65% relative humidity.
Hydration experiment
The hydration experiment was carried out on the volar forearm of one female volunteer (aged 35 years). The skin was hydrated for 15, 50 and 90 min by application of 120 μl distilled water on a 6 × 6 mm cotton wool patch, covered with an adhesive bandage. Raman spectra of the skin were recorded before and after hydration.
Calculation of water content
Water-to-protein ratio in the SC was calculated as the ratio between the intensity of the Raman signal of water (due to OH-stretching vibrations) integrated over 3350–3550 cm–1 and that of protein (due to CH3-stretching vibrations) integrated over 2910–2966 cm–1.Water content (mass-%), expressed in grams of water per 100 g of wet tissue (water + dry mass), was calculated from the water-to-protein ratio (21–23).
Estimation of stratum corneum thickness
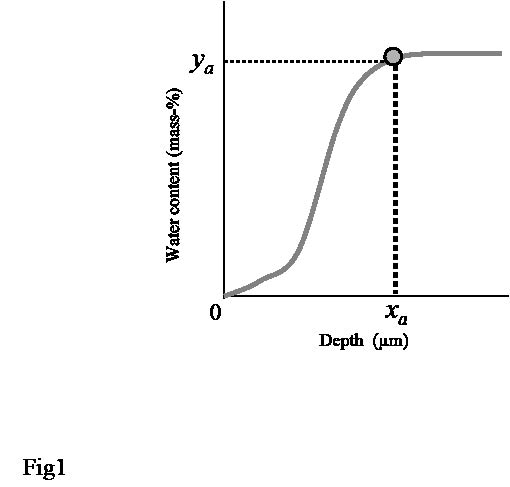
SC thickness was estimated from the water concentration profile (Fig. 1). The first derivative of water concentration profile was calculated by moving average to find the depth (xa) at which the rate of change became almost zero, i.e. where the water content reached an almost constant value (ya). We defined SCAT as xa (μm).
Fig. 1. The principal for estimation of stratum corneum apparent thickness (SCAT) from water concentration profile. SCAT was defined as xa(μm), i.e. the depth at which the water content reached an almost constant value.
Data analysis
MATLAB (Version 7.0.4 (R14), The MathWorks, Inc., Natick, USA) and Microsoft Excel 2002 (Microsoft Corporation, WA, USA) were employed for data analysis. Analysis of variance was used to compare differences between body sites. A p-value < 0.05 was considered significant.
RESULTS
Site variations in water concentration profiles
Using Raman spectrometry the water content was measured in the skin of 15 healthy subjects. Fig. 2 shows the in vivo water concentration profiles of the cheek, upper arm, volar forearm, back of the hand and palm, respectively. The water concentration profiles of the cheek, upper arm, volar forearm and back of the hand were similar: the water content at the skin surface was 30–40%, and gradually increased with increasing depth until it reached a constant value of 65–70%. In contrast, the water content of the palm was around 20–30% at the skin surface, then slightly increased to 40%, and finally rapidly increased to a constant value of 60–70%. Individual variations were seen both in water content at the skin surface and in constant water content value in deeper parts, especially at the palm.
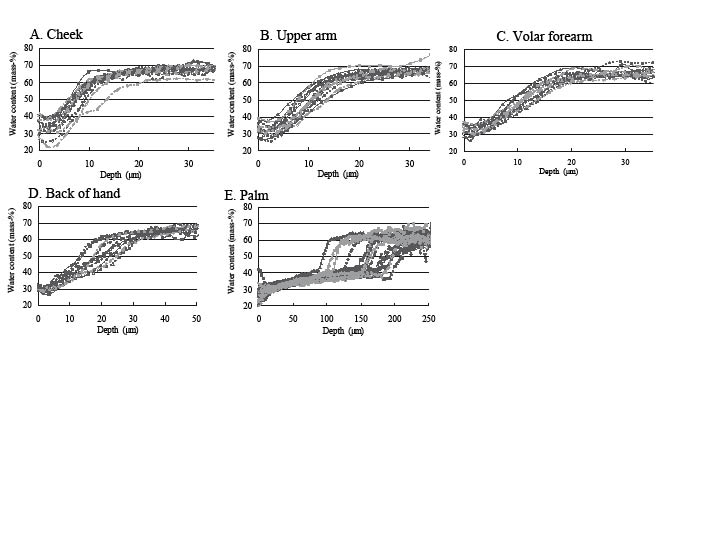
Fig. 2. Water concentration profiles of 15 subjects. (A) Cheek, (B) upper arm, (C) volar forearm, (D) back of the hand, (E) palm.
Site variations in stratum corneum apparent thickness
SCAT was calculated as described in the Materials and Methods section. Examples of water concentration profiles from cheek and palm are shown in Fig. 3A. The first derivative of the water concentration profiles are shown in Fig. 3B and C. SCAT was defined as the depth at which the first derivative fell below 0.5 (for cheek, upper arm, volar forearm and back of hand) or 0.1 (for palm) and the water content value became almost constant (shown with an arrow in Fig. 3B and C).
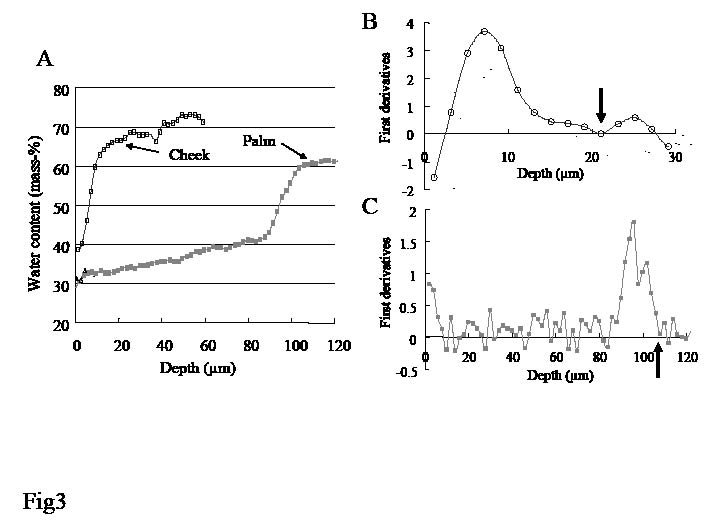
Fig. 3. (A) Water concentration profile and (B, C) first derivative profiles of the cheek and palm, respectively. Stratum corneum apparent thickness (SCAT) is defined as the depth at the position indicated with arrows. Examples from one individual.
Site variations of SCAT were compared (Table I):mean SCAT was lowest at the cheek (16.8 μm), intermediate at the upper arm and volar forearm, slightly thicker at the back of the hand (29.3 μm), and thickest at the palm (173.0 μm). By analysis of variance there were significant differences (p < 0.001) between the palm and cheek, palm and upper arm, palm and forearm, and palm and back of the hand.
Table I. Stratum corneum apparent thickness (SCAT) at different body sites
| No. of subjects | Mean | Standard deviation | |
| Cheek | 15 | 16.8 | 2.84 |
| Upper arm | 15 | 21.8 | 3.63 |
| Forearm | 14 | 22.6 | 4.33 |
| Back of hand | 13 | 29.3 | 6.84 |
| Palm | 15 | 173.0 | 36.96 |
Significant differences (p < 0.001) were seen between the palm and cheek, palm and upper arm, palm and forearm, and palm and back of hand.
Age variations in stratum corneum apparent thickness
There was a positive correlation between age and SCAT measured at the forearm, while no correlation was found at the cheek in female subjects. Age variations in SCAT at the forearm were larger than those at the cheek (Fig. 4).
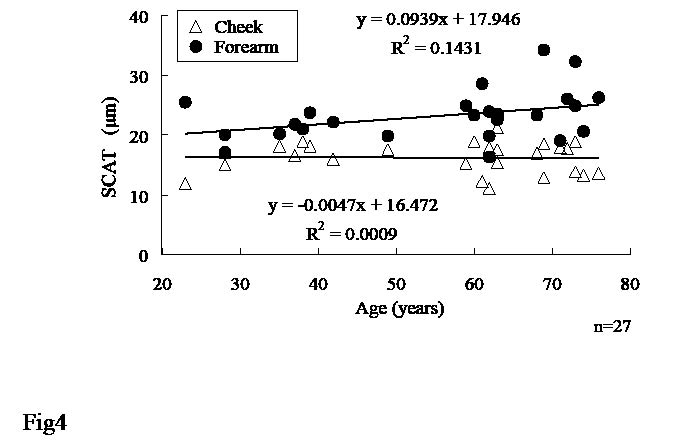
Fig. 4. Age variations in stratum corneum apparent thickness (SCAT) at cheek and forearm. Regression lines and equations are shown for cheek (top) and forearm (bottom) separately.
Change in stratum corneum apparent thickness after hydration
It is clear that the water content value becomes higher in the upper area of the SC after hydration when studying the water concentration profiles of the skin before and after hydration for 50 min in one healthy women (Fig. 5). By contrast, the water content value deeper in the skin (around 65%) was unchanged by the 50 min hydration process. Table II shows the change in SCAT at the volar forearm after hydration for 15, 50 and 90 min with water-soaked cotton wool. SCAT was increased almost two-fold from the initial value after hydration for 90 min, while smaller increases were seen at short hydration periods.
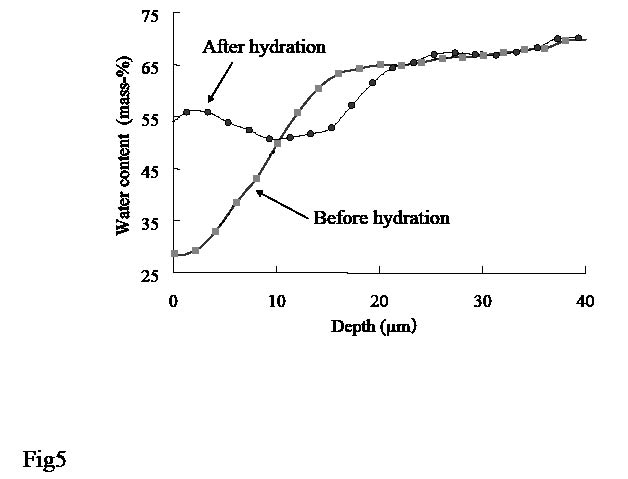
Fig. 5. Water concentration profiles of forearm skin before and after hydration for 50 min with water-soaked cotton wool. Stratum corneum apparent thickness was 18.1 µm before hydration and 25.3 µm after hydration.
Table II. Change in stratum corneum apparent thickness (SCAT) at volar forearm after hydration for 15, 50, and 90 min with water-soaked cotton wool
| Hydration period (min) | Initial (µm) | After hydration (µm) | Ratio* |
| 15 | 18.4 | 19.1 | 1.04 |
| 50 | 18.1 | 25.3 | 1.40 |
| 90 | 18.7 | 36.6 | 1.95 |
*Ratio of SCAT after hydration against initial SCAT.
DISCUSSION
This study examined non-invasive estimation of SC thickness by calculation from the water concentration profiles obtained with a confocal Raman spectrometer (21–23). From previous theoretical prediction (13) and in vitro X-ray analysis (11) it was suggested that water content value reached an almost constant value at viable granulosum. However, as it is difficult to calculate the boundary between SC and stratum granulosum from water concentration profiles, we defined SCAT as the depth (xa) where the water content reached an almost constant value. Therefore, SCAT would include the upper part of the stratum granulosum in addition to the SC. As with previously reported in vivo methods for calculating SC thickness (8–10), it is not clear whether they accurately detect the boundary between SC and stratum granulosum.
The SC thickness at the volar forearm of Nordic subjects measured by in vitro light microscopy that does not include formalin-paraffin processing was 18.3 μm (6, 7). Analogously the SC thicknes at the palm, measured with in vivo pulsed terahertz radiation, was 170 μm in Caucasian subjects (10). The corresponding SCAT values, calculated from the water concentration profile of Japanese subjects, were 22.6 μm at the volar forearm and 173 μm at the palm, i.e. almost identical to previous estimations of SC thickness.
Regarding site variations, the mean SC thickness determined by standard light microscopy (24), varied from being high at the palm (90 μm) and back of hand (65 μm), to low at the cheek (15 μm) with intermediate values observed at volar forearm (45 μm) and upper arm (57 μm). However, as the authors used the formalin-paraffin technique, which influences SC thickness, absolute values are not comparable with our method. Ya-Xian et al. (25) reported that the number of cell layers of the SC was 10 at the cheek, 14 at the upper arm, 16 at the volar forearm, 25 at the back of the hand and 50 at the palm. This site variation is consistent with our data, on the assumption that SC thickness is correlated with the number of cell layers of the SC. Sandby-Möller et al. (7) demonstrated that the influence of body site far exceeds the inter-individual differences. Our data (Table I) support these findings.
As for change with ageing, Sandby-Möller et al. (7) reported that SC thickness at the forearm was independent of age; their age range was 20–68 years (Nordic males and females). Our data showed that SCAT was especially high in the oldest Japanese female subjects (68–76 years). Perhaps if previous data had included more elderly subjects, the results might have looked different. Also, gender differences should be considered. Ya-Xian et al. (25) found an age-dependent increase (1–97 years) in the number of cell layers of the SC at the cheek in Japanese male subjects, but not in females. We too found a small age variation in SCAT at the cheek in females (Fig. 5).
Recently, Huzaira et al. (26) reported SC thickness estimated from horizontal images of the skin by in vivo reflectance confocal microscopy, obtaining mean values of 9.6 μm at the volar forearm and 12.1 μm at the cheek, which are much lower than ours and those of previous investigators using the new light microscopy method (6, 7). In addition, site variations in the report by Huzaira et al.(26) were different from ours and previous report (24).
Finally, we followed the change in SCAT caused by a hydration process (Fig. 5). It was previously reported that the average thickness of a corneocyte at a low hydration level (18–26% wt/wt) is 300 nm, and this was increased up to two-fold at hydration levels of 57–87% wt/wt, as evaluated with cryo-scanning electron microscopy (27). Our in vivo finding, that the SCAT after hydration for 90 min was increased 1.95 times from the initial value (Table II), supports previous in vitro results.
As changes in SCAT appear to mimic SC thickness measured by other methods, the SCAT value promises to be useful for recording changes in SC thickness in vivo.
REFERENCES
1. Freeman RG, Cockerell EG, Armstrong J, Knox JM. Sunlight as a factor influencing the thickness of epidermis. J Invest Dermatol 1962; 39: 295–298.
2. Thomson ML. Relative efficiency of pigment and horny layer thickness in protecting the skin of Europeans and Africans against solar ultraviolet radiation. J Physiol 1955; 127: 236–246.
3. Lock-Andersen J, Therkildsen J, de Fine Olivarius F, Gniadecka M, Dahlstrøm K, Poulsen T, et al. Epidermal thickness, skin pigmentation and constitutive photosensitivity. Photodermatol Photoimmunol Photomed 1997; 13: 153–158.
4. Holbrook KA, Odland GF. Regional differences in the thickness (cell layers) of the human stratum corneum: an ultrastructural analysis. J Invest Dermatol 1974; 62: 415–422.
5. Southwood WFW. The thickness of the skin. Plast Reconstr Surgery 1955; 15: 423–429.
6. Therkildsen P, Hædersdal M, Lock-Andersen J, de Fine Olivarius F, Poulsen T, Wulf HC. Epidermal thickness measured by light microscopy: a methodological study. Skin Res Technol 1998; 4: 174–179.
7. Sandby-Möller J, Poulsen T, Wulf HC. Epidermal thickness at different body sites: relationship to age, gender, pigmentation, blood content, skin type and smoking habits. Acta Derm Venereol 2003; 83: 410–413.
8. Nouvearu-Ricard S, Monot M, Bastien P, de Lacharrière O. In vivo epidermal thickness measurement: ultrasound vs. confocal imaging. Skin Res Technol 2004; 10: 136–140.
9. Pickwell E, Cole BE, Fitzgerald AJ, Pepper M, Wallace VP. In vivo study of human skin using pulsed terahertz radiation. Phys Med Biol 2004; 49: 1595–1607.
10. Querleux B. Nuclear magnetic resonance (NMR) examination of the epidermis in vivo. In: Serup J, Jemec GBE, editors. Handbook of non-invasive methods and the skin. Boca Raton: CRC Press, 1995: p. 133–139.
11. Warner RR, Myers MC, Taylor DA. Electron probe analysis of human skin: determination of the water concentration profile. J Invest Dermatol 1988; 90: 218–224.
12. Von Zglinicki T, Lindberg M, Roomans GM, Forslind B. Water and ion distribution profiles in human skin. Acta Derm Venereol 1993; 73: 340–343.
13. Stockdate M. Water diffusion coefficients versus water activity in stratum corneum: a correlation and its implications. J Soc Cosmetic Chemists 1978; 29: 625–639.
14. Tagami H, Ohi M, Iwatsuki K, Kanamaru Y, Yamada M, Ichijo B. Evaluation of the skin surface hydration in vivo by electrical measurement. J Invest Dermatol 1980; 75: 500–507.
15. Clarys P, Gabard B, Barel A. Non-invasive electrical measurement for the evaluation of the hydration state of the skin: Comparison between three usual equipments, the Corneometer, the Skicon and the Nova DPM. Skin Res Technol 1999; 5: 14–20.
16. Fluhr JW, Gloor M, Lazzerini S, SCeesz P, Grieshaber R, Berardesca E. Comparative study of five instruments measuring stratum corneum hydration. Skin Res Technol 1999; 5: 171–178.
17. Woo YA, Ahn JW, Chun K, Kim HY. Development of a method for the determination of human skin moisture using a portable near-infrared system. Anal Chem 2001; 73: 4964–4971.
18. Arimoto H, Egawa M. Non-contact skin moisture measurement based on near-infrared spectrosopy. Appl Spectrosc 2004; 58: 1439–1446.
19. Arimoto H, Egawa M, Yamada Y. Depth profile of diffuse reflectance near-infrared spectrosocpy for measurement of water content in skin. Skin Res Technol 2005; 11: 27–35.
20. Egawa M, Arimoto H, Hirao T, Takahashi M, Ozaki Y. Regional difference of water content in human skin studied by diffuse-reflectance near-infrared spectroscopy – consideration of measurement depth. Appl Spectrosc 2006; 60: 24–28.
21. Caspers PJ, Lucassen GW, Wolthuis R, Bruining HA, Puppels GJ. In vitro and in vivo Raman spectroscopy of human skin. Biospectroscopy 1998; 4: S31–S39.
22. Caspers PJ, Lucassen GW, Bruining HA, Puppels GJ. Automated depth-scanning confocal Raman microspectrometer for rapid in vivo determination of water concentration profiles in human skin. J Raman Spectrosc 2000; 31: 813–818.
23. Caspers PJ, Lucassen GW, Carter EA, Bruining HA, Puppels GJ. In vivo confocal Raman microspectroscopy of the skin: noninvasive determination of molecular concentration profiles. J Invest Dermatol 2001; 116: 434–442.
24. Asou K. In: Yamamura Y, Kuboki J, editors. Handbook of dermatology (3A) (in Japanese). Tokyo: Nakayama-Shoten Co. Ltd, 1982: p. 327.
25. Ya-Xian Z, Suetake T, Tagami H. Number of cell layers of the stratum corneum in normal skin relationship to the anatomical location on the body, age, sex and physical parameters. Arch Dermatol Res 1999; 291: 555–559.
26. Huzaira M, Ruis F, Rajadhyaksha M, Anderson R, González S. Topographic variation in normal skin, as viewed by in vivo reflectance confocal microscopy. J Invest Dermatol; 116: 846–852.
27. Bouwstra JA, de Graaff A, Gooris GS, Nijsse J, Wiechers JW, van Aelst AC. Water distribution and related morphology in human stratum corneum at different hydration levels. J Invest Dermatol 2003; 120: 750–758.

